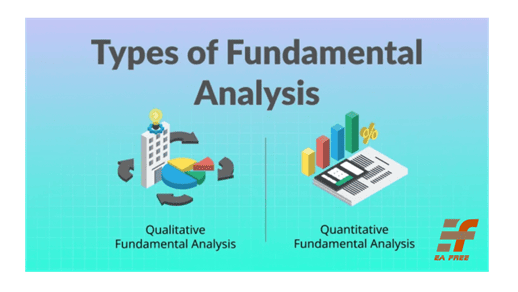
When trading Forex, understanding both fundamental and technical analysis is important to make smart investment decisions. Here is an introduction to both methods:
Table of contents
I. Fundamental Analysis
Fundamental analysis is the study of economic, political and social factors that influence the value of money.
Here are some important aspects:

- Politics and Political Stabilitas: A country’s political stability, political events and financial policies can all affect currency values.
- Market News and Events: Information about market events, trade agreements, and international events can also create large fluctuations in the market.

- Economic Indicators: Adjusting economic indicators such as GDP, unemployment rate and industrial production can give you deeper insight into a country’s economic health.
II. Technical Analysis
- Is the study and evaluation of historical data on prices, trading volume and other indicators to predict the future price direction of a currency pair.
- Technical analysis helps investors and Forex traders better understand market trends and create trading strategies based on the information collected.
- Technical analysis focuses on using historical price and volume data to predict the future direction of the market.
Here are some important tools and concepts:
1. Moving Averages Indicator
This is a tool often used to determine market trends. Simple moving averages (SMA) and moving averages (EMA) are two popular types.
- Determining the Trend: When the price is above the moving average, the trend is considered uptrend, while when the price is below the moving average, the trend is considered downtrend.
- Determining Buy and Sell Points: When using moving averages with different time series, investors can determine buying points (when the price crosses the average from the bottom up) and selling points (when price crosses the moving average from top to bottom).
- Identify Support and Resistance: Create support and resistance levels. When the price is far from the moving average, it can be a sign of an overbought or oversold market.
- Determining the Strength of the Trend: When the price is far away from the moving average, this can indicate a strong trend.
- Determine Profit Points and Stop Loss: Investors can use moving averages to determine the desired price level to set profit and take profit.

2. MACD Indicator (Moving Average Convergence Divergence):
MACD is a popular technical indicator in Forex trading, designed to measure the difference between two moving averages (EMAs) with different time series.
This helps investors identify trends and trend strength, as well as market entry and exit points.
Here is how the MACD line is applied in Forex trading:

- Identifying the Trend: When the MACD line is above the moving average, this indicates an uptrend. Conversely, when MACD is below the average line, the trend is down.
- Determine Buying and Selling Points: When the MACD line crosses above the moving average, this may be a buying point. When MACD crosses below the moving average, this could be a selling point.
- Determining Trend Strength: A rapidly rising MACD line means a strong uptrend, while a decreasing trend can indicate a weak trend.
- Identifying Profit Points and Stop Loss: When MACD is close to zero, it can be a sign that the trend is about to end and profit taking can be considered.
3. Bollinger Bands Indicator:
Bollinger Bands is an indicator based on price volatility. It helps determine the level of market volatility and trend limits.

- Identifying Volatility: When Bollinger Bands widen, this usually indicates an increase in market volatility. Conversely, when the band contracts, this usually indicates a decrease in volatility.
- Identifying Buy and Sell Points: A popular strategy is to buy when the price touches or crosses the lower band and sell when the price touches or surpasses the upper band.
- Identify Overbought and Oversold: When price continues to touch or surpass the upper band, this may indicate an overbought market. Conversely, when the price touches or crosses the lower band, this can indicate an oversold market.
- Identifying Trends and Reversals: When price moves to or surpasses the upper or lower band and then begins to move back inside the band, this can be a sign of a reversal in trend.
- Identifying Divergence: When the price continues to rise and the Bollinger Bands fall, or vice versa, it can indicate a divergence and could be a sign of a trend reversal.
III. Important Note:
Combining Fundamental and Technical Analysis: Many investors combine both types of analysis to get a comprehensive view of the market.

- Understand the Fundamentals Before Applying the Techniques: Fundamental analysis focuses on the economic, political, and social factors that influence the market. Before you start using technical indicators, have a clear understanding of the fundamental factors that influence the currency pairs you are interested in.
- Identifying Overall Trends with Fundamental Analysis: This can help you identify long-term trends and decide on trading positions based on that trend.
- Use Technical Indicators to Identify Entry and Exit Points: Once you have determined the overall trend from fundamental analysis, use technical indicators to identify buy and sell points. This includes using moving averages, MACD, Bollinger Bands and other indicators to identify short-term trends and market entry/exit points.
- Risk Management: Combining both analysis methods helps you assess the level of risk.
- Follow News and Events: Both fundamental and technical analysis are influenced by market news and events. Stay tuned for news that could affect the financial markets.
- Practice and Improve Your Skills: Practicing on a demo account before trading really helps you improve your skills and gain confidence in using both methods.
IV. Conclude
Fundamental and technical analysis both play an important role in predicting trends and making trading decisions in Forex. A deeper understanding of both these methods will help you become a proficient and successful investor in the currency markets.

