
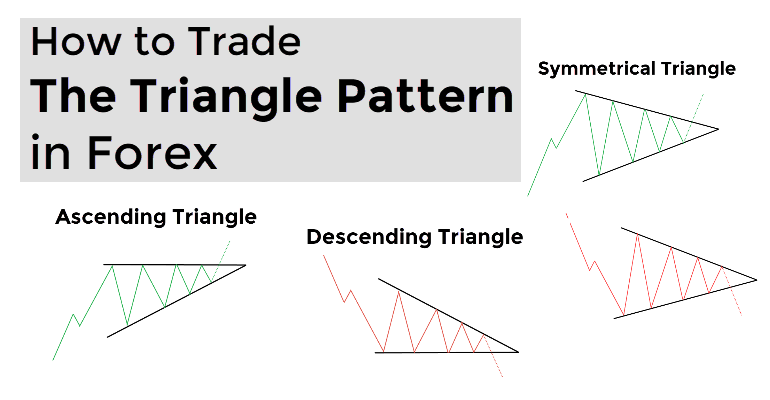
The Triangle Pattern is one of the most popular price patterns in technical analysis. This pattern is formed by two trend lines converging towards a point. These trend lines can be upward sloping, downward sloping, or horizontal. The Triangle pattern is often considered a reversal pattern, indicating that price is likely to change direction after the pattern is completed. However, this pattern can also be considered a trend continuation pattern, suggesting that the price will continue in the current trend.
In this article, we will learn about the Triangle pattern, the steps to trade this pattern, the benefits of using the Triangle pattern in trading, and how to recognize and identify the pattern. chart, how to use the model to make trading decisions, notes when trading the Triangle model, real-life examples and finally effective trading strategies with the model Triangle.
Table of contents
- Introduction to the Triangle model
- Steps to trade the Triangle pattern
- Benefits of using the Triangle pattern in trading
- How to recognize and identify the Triangle pattern on the chart
- How to use the Triangle pattern to make trading decisions
- Things to note when trading the Triangle pattern
- Real-life examples of trading the Triangle pattern
- Effective trading strategies with the Triangle pattern
- Practice trading the Triangle pattern on trading floors
- Summary and advice when applying the Triangle model in trading
Introduction to the Triangle model
The Triangle pattern is one of the most popular price patterns in technical analysis. This is a simple model but very effective in predicting the next price trend of an asset. This pattern is considered a reversal pattern, indicating that the price is likely to change direction after the pattern is completed. However, the Triangle pattern can also be considered a trend continuation pattern, suggesting that the price will continue in the current trend.
To better understand the Triangle pattern, we need to learn about two types of patterns: Ascending Triangle and Descending Triangle.
Ascending Triangle
The Rising Triangle is a pattern in the form of a horizontal triangle with a rising price trend line and a horizontal line at the highest price of the pattern. The common point of the peaks in this pattern is that the price cannot surpass the highest price, forming a horizontal line.

When the price tries to break through this horizontal line, it will be pushed back and form a support line. This shows the balance between demand and supply in the market. Once the Rising Triangle pattern is completed, the price is likely to continue rising in line with the current trend.
Descending Triangle
The Falling Triangle is a pattern in the form of a horizontal triangle with a downtrend line and a horizontal line at the lowest price of the pattern. The common point of the bottoms in this model is that the price cannot decrease further, forming a horizontal line.

When the price tries to fall further, it will be pushed up and form a resistance line. This shows the balance between demand and supply in the market. Once the Bearish Triangle pattern is completed, the price will likely continue to decline following the current trend.
Steps to trade the Triangle pattern
Here are the basic steps to trade the Triangle pattern:
- Determine the current trend: Before trading the Triangle pattern, you need to determine the current trend of the market. The Triangle pattern can be a reversal pattern or a trend continuation pattern. If the market is in an uptrend, a Rising Triangle pattern will indicate that the price is likely to continue rising after the pattern is completed. Conversely, if the market is in a downtrend, a Descending Triangle pattern will indicate that the price is likely to continue falling after the pattern is completed.
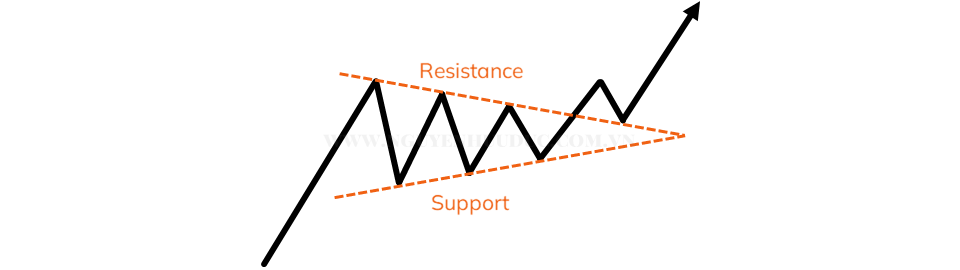
- Identifying the Triangle pattern: To identify the Triangle pattern, you need to identify two trend lines converging to a point. These trend lines can be drawn by connecting the tops or bottoms of the chart. Triangle patterns usually have at least 4 defining points.
- Model confirmation: After identifying the model, you need to confirm the model by observing the trend lines and general points of the model. If the pattern is confirmed, you can proceed with trading according to this pattern.
Benefits of using the Triangle pattern in trading
The Triangle pattern is a useful tool in technical analysis and has many benefits when used in trading:
- Easy to recognize: With its simple and clear shape, the Triangle pattern is easy to recognize on the chart, helping you quickly identify trends and make trading decisions.
- High probability of success: The Triangle pattern has a quite high success rate, helping you increase your chances of winning in trading.
- Simple and effective: Without using many indicators or complex analysis tools, the Triangle model can still provide accurate and effective trading signals.
- Applicable on many markets: The Triangle model can be applied on many different markets such as stocks, foreign exchange, commodities, cryptocurrencies…
How to recognize and identify the Triangle pattern on the chart
To recognize and identify the Triangle pattern on the chart, you need to pay attention to the following factors:
- Trend lines: The Triangle pattern usually has two trend lines converging to a point. The uptrend line will connect the bottoms of the pattern, and the downtrend line will connect the tops.
- Commonalities: The commonalities of the peaks or valleys in the Triangle pattern are important to define the pattern. When the price cannot overcome this common point, it forms a horizontal line and shows the balance between demand and supply in the market.
- Duration: The Triangle pattern can last from several weeks to several months. Therefore, you need to be patient and observe carefully to identify this pattern on the chart.
- Trading volume: During the formation of the Triangle pattern, trading volume often gradually decreases and increases again when the pattern is completed. This shows an accumulation of demand and supply before the price explodes in a new direction.
How to use the Triangle pattern to make trading decisions
Once you have identified the Triangle pattern on the chart, you can use the following strategies to make trading decisions:
- Trend Trading: If the market is in an uptrend and the Rising Triangle pattern is confirmed, you can buy when the price breaks through the top of the pattern. Conversely, if the market is in a downtrend and the Bearish Triangle pattern is confirmed, you can sell when the price breaks through the bottom of the pattern.
- Reaction trading: If the price breaks through the top or bottom of the Triangle pattern but is not confirmed, it could be a reaction signal. You can buy or sell when the price reacts from the common point of the pattern.
- Divergence Trading: If price creates a new high or low in a Triangle pattern but technical indicators show divergence, it could be a reversal trading signal. You can buy or sell when the price reacts from the common point of the pattern.
Things to note when trading the Triangle pattern
- Always determine the current trend before trading the Triangle pattern.
- Reconfirm the model before making a trading decision.
- It is recommended to use other technical analysis tools to confirm trading signals.
- Always set stop loss and take profit to protect your investment capital.
- You should not trade when the market has strong fluctuations or important news is announced.
Real-life examples of trading the Triangle pattern
Example 1: Trend trading

In this example, we can see a Rising Triangle pattern on the chart of the EUR/USD currency pair. The price has created two peaks close together and the common point is 1.1200. Once the price breaks through this common point, the pattern is confirmed and the price continues to rise in the current trend.
Example 2: Reactive trading

In this example, we can see a Bearing Triangle pattern on the chart of the USD/CAD currency pair. The price broke through the bottom of the pattern but was not confirmed, creating a reaction signal. After that, the price reacts from the common point of the pattern and continues to decline according to the current trend.
Example 3: Divergence trading
In this example, we can see a Rising Triangle pattern on the pair’s chart. The price has created two peaks close together but the MACD indicator shows divergence. After the price reacted from the common point of the pattern, it reversed and decreased according to the new trend.
Effective trading strategies with the Triangle pattern
- Breakout Strategy: This is the simplest and most popular trading strategy with the Triangle pattern. You can buy or sell when the price surpasses the top or bottom of the pattern.
- Pullback Strategy: This is a trading strategy based on the reaction signal of the Triangle pattern. You can buy or sell when the price reacts from the common point of the pattern.
- Divergence Strategy: This is a trading strategy based on the divergence between price and technical indicators. You can buy or sell when the price reacts from the common point of the pattern.
Practice trading the Triangle pattern on trading floors
You can practice trading the Triangle pattern on Forex, stock, cryptocurrency exchanges… You can use technical analysis tools such as charts, indicators, trend lines to identify patterns and make trading decisions.
Summary and advice when applying the Triangle model in trading
The Triangle pattern is a useful tool in technical analysis and can help you make accurate and effective trading decisions. However, to apply this model successfully, you need to have enough trading knowledge and experience to identify and use the model correctly. Always remember to set stop loss and take profit to protect your investment capital and do not trade when the market has strong fluctuations or important news is announced. Wishing you successful trading!