
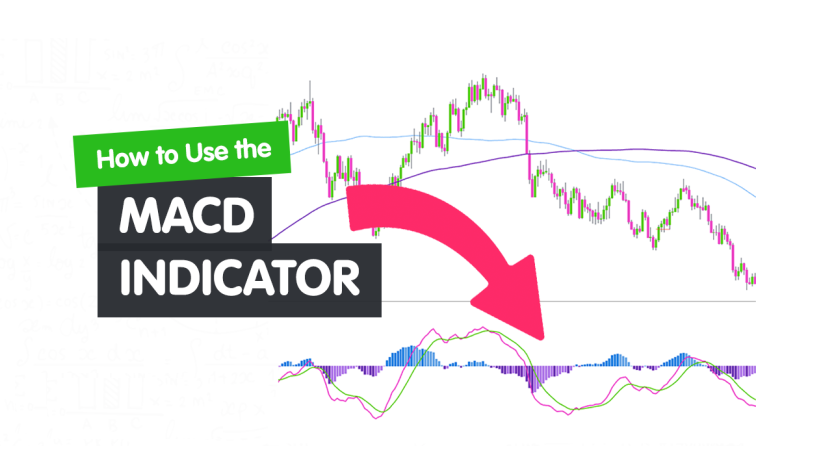
The MACD (Moving Average Convergence/Divergence) indicator is one of the most important and popular technical tools in stock trading. Developed by Gerald Appel in 1979, this indicator has been widely used by traders worldwide to identify price trends, momentum and divergences. In this article, we will learn about the MACD indicator, how to calculate and use it in trading, as well as the benefits and points to keep in mind when using this indicator.
Table of contents
- Introduction to the MACD indicator
- How to calculate MACD indicator
- Components of the MACD indicator
- How to use the MACD indicator in trading
- Analyze buy and sell signals from the MACD indicator
- Trading strategies with MACD indicator
- Benefits of using the MACD indicator
- Points to note when using the MACD indicator
- Illustrative examples of how to use the MACD indicator
- Summary and advice when using the MACD indicator
Introduction to the MACD indicator
The MACD indicator is a technical indicator used to analyze price trends and momentum. It is made up of three lines: MACD line, signal line and zero line.
MACD lines
The MACD line represents the difference between two 12- and 26-day exponential moving averages (EMA). This is the main line of the MACD indicator and can have positive or negative values.
Signal line
The signal line is the 9-day EMA of the MACD line. This line can help determine the trend of the MACD line and is used to generate buy and sell signals.
Zero line
The zero line is the zero value line of the MACD line. This line can help identify buy and sell signals when the MACD line crosses the zero line.
How to calculate MACD indicator
The formula for calculating the MACD line is as follows:
MACD = EMA12 - EMA26
The formula for calculating the signal line is as follows:
Signal = EMA9(MACD)
In which, EMA is an exponential moving average and is calculated by taking the average of values over a certain period of time.
For example: To calculate the 12-day EMA, we will take the average of the values over the last 12 days. However, traders can adjust this period to suit their trading strategy.
Components of the MACD indicator

The MACD indicator is made up of three lines: the MACD line, the signal line and the zero line. Let’s learn about these components in detail.
MACD lines
The MACD line is the main line of the MACD indicator and represents the difference between the 12 and 26 day EMAs. If the MACD line has a positive value, this shows that the market is in an uptrend. Conversely, if the MACD line has a negative value, the market is in a downtrend.
Signal line
The signal line is the 9-day EMA of the MACD line. This line can help determine the trend of the MACD line and is used to generate buy and sell signals. When the MACD line crosses the signal line from below, this is a buy signal. Contrary, when the MACD line crosses the signal line from top to bottom, this is a sell signal.
Zero line
The zero line is the zero value line of the MACD line. This line can help identify buy and sell signals when the MACD line crosses the zero line. When the MACD line crosses the zero line from below, this is a buy signal. Contrary, when the MACD line crosses the zero line from above, this is a sell signal.
How to use the MACD indicator in trading
The MACD indicator can be used to identify price trends, momentum, and divergences. Here are some ways to use the MACD indicator in trading:
Identify trends
The MACD line can be used to determine market trends. If the MACD line has a positive value, this shows that the market is in an uptrend. Conversely, if the MACD line has a negative value, the market is in a downtrend.
Determine momentum
The MACD line can also help determine market momentum. If the MACD line has an increasing value, this shows that the market momentum is increasing. Conversely, if the MACD line has a decreasing value, this shows that the market momentum is decreasing.
Determine divergence
Divergence is a phenomenon when the stock price increases sharply but the indicator does not increase accordingly. This shows a weakening of the trend and could be a sell signal. The MACD indicator can help identify divergences by comparing the MACD line with the price chart.
Analyze buy and sell signals from the MACD indicator
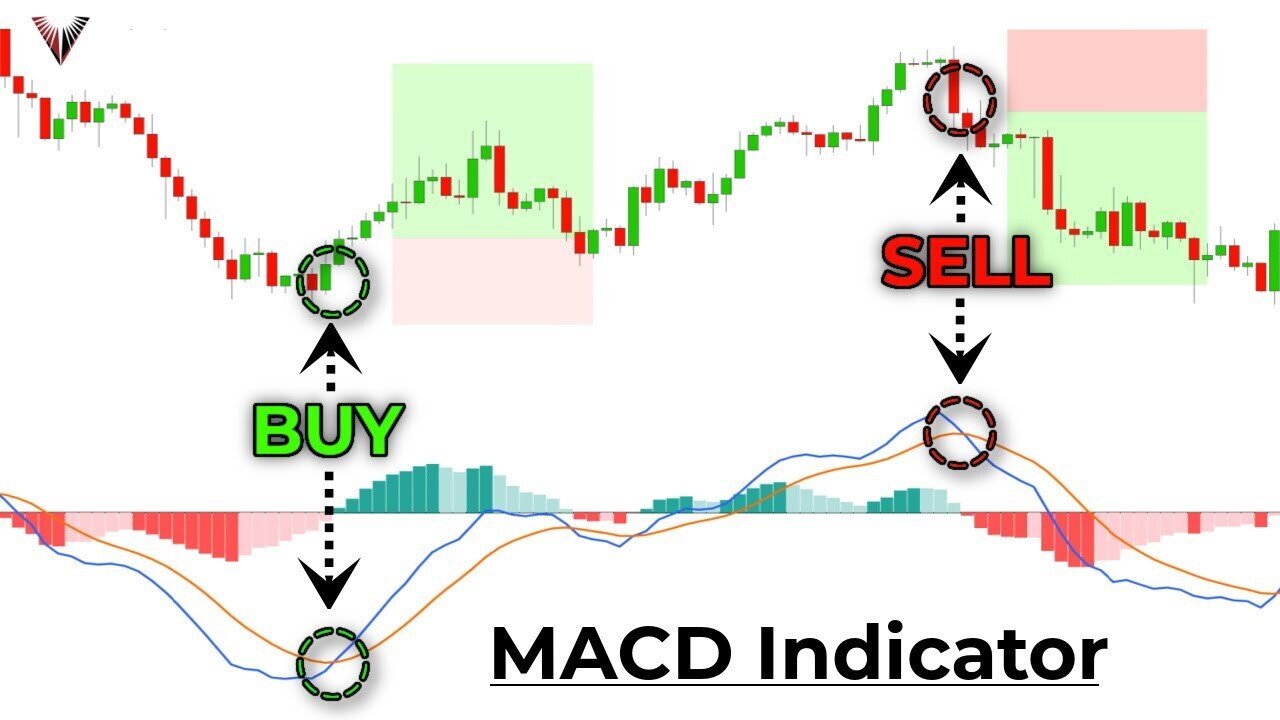
The MACD indicator can generate buy and sell signals through the crossing of lines. Here are some buy and sell signals through the MACD indicator:
- Buy signal: When the MACD line crosses the signal line from below or when the MACD line crosses the zero line from below.
- Sell signal: When the MACD line crosses the signal line from top to bottom or when the MACD line crosses the zero line from top to bottom.
Trading strategies with MACD indicator
The MACD indicator can be used in many different trading strategies. Here are some popular strategies when using the MACD indicator:
Trend following strategy
This strategy focuses on identifying and tracking market trends. When the MACD line has a positive value, we will look for buying opportunities and when the MACD line has a negative value, we will look for selling opportunities.
Momentum strategy
This strategy focuses on identifying market momentum and finding entry and exit points based on changes in the MACD line. When the MACD line increases, we will look for buying opportunities and when the MACD line decreases, we will look for selling opportunities.
Divergence strategy
This strategy focuses on identifying divergences and looking for entry and exit points into the market based on trend weakness. When the MACD line increases sharply but the stock price does not increase, we can consider this a sell signal.
Benefits of using the MACD indicator
Using the MACD indicator has many benefits for traders, including:
- Helps identify market trends and momentum.
- Provides buy and sell signals based on line crossings.
- Helps identify divergences and find market entry and exit points.
- Widely used and supported by many trading platforms.
Points to note when using the MACD indicator
Although the MACD indicator is a useful tool in trading, there are also points to keep in mind when using it:
- The MACD indicator is not a perfect tool and can give misleading signals in some cases.
- The MACD indicator should be used in combination with other tools and indicators to ensure the accuracy of the signals.
- It is necessary to practice and carefully test the trading strategy before applying it in practice.
Illustrative examples of how to use the MACD indicator
To better understand how to use the MACD indicator in trading, let’s look at some of the following illustrative examples:
Example 1: Use the MACD indicator to determine the trend
In the chart below, we can see that the MACD line (red line) has a positive value, showing that the market is in an uptrend. This is confirmed by the fact that the MACD line crosses the zero line from below.

Example 2: Use the MACD indicator to determine buy and sell signals
In the chart below, we can see when the MACD line (red line) crosses the signal line (green line) from above, which indicates a sell signal. Then, when the MACD line crosses the signal line from the bottom up, we can get a buy signal.

Summary and advice when using the MACD indicator
The MACD indicator is a useful tool in trading and can help traders identify market trends, momentum, and divergences. However, as with any other trading tool or strategy, using the MACD indicator also requires caution and careful testing before applying it in practice. It is recommended to combine this indicator with other tools and strategies to ensure the accuracy of the signals. We should also practice and test carefully before using the MACD indicator in actual trading.