
The Stochastic indicator is one of the important tools in technical analysis and is widely used in forex trading. It helps traders measure price fluctuations and identify market trends and reversal points. In this article, we will learn about the Stochastic indicator, how to calculate it, and how to use it in forex trading.
Table of contents
- What is the Stochastic indicator?
- How to calculate the Stochastic indicator
- Basic parameters of the Stochastic indicator
- Meaning of the Stochastic indicator
- Benefits of using the Stochastic indicator
- How to read and understand the Stochastic indicator
- Ways to use the Stochastic indicator in trading
- Common mistakes when using the Stochastic indicator
- Trading strategies with the Stochastic indicator
- Compare the Stochastic indicator with other indicators
- Conclude
What is the Stochastic indicator?
.png "Instructions for using the Stochastic indicator in forex trading")
The Stochastic indicator is an oscillating indicator used in technical analysis to measure price fluctuations relative to the highest and lowest prices over a given period of time. This indicator was developed by George Lane in 1951 and is commonly used in trading forex, stocks and other asset types.
The Stochastic indicator is calculated based on the closing price of an asset over a certain period of time. Typically, this period is used as 14 days. The formula for calculating the Stochastic indicator is as follows:
%K = (C - L14) / (H14 - L14) * 100
%D = (%K của ngày hôm nay + %K của ngày hôm qua) / 2
In there:
- C is the closing price of the current day.
- L14 is the lowest price in 14 days.
- H14 is the highest price in 14 days.
How to calculate the Stochastic indicator
To calculate the Stochastic indicator, we need information about the closing price of an asset over a certain period of time. Then we will apply the formula mentioned above to calculate the values of %K and %D.
For example: The closing price of a EUR/USD currency pair for 14 days is 1.2000, 1.2050, 1.2100, 1.2150, 1.2200, 1.2250, 1.2300, 1.2350, 1.2400, 1.2450, 1.2500, 1.2550, 1.2 respectively. 600, 1.2650. So the values of %K and %D will be:
%K = (1.2650 - 1.2000) / (1.2600 - 1.2000) * 100 = 62.5
%D = (62.5 + 50) / 2 = 56.25
Basic parameters of the Stochastic indicator
The Stochastic indicator has two basic parameters: %K and %D.
- %K: Is the initial value of the Stochastic indicator. It shows the degree of price fluctuation compared to the highest and lowest price during the considered period.
- %D: Is the moving average value of %K. It helps smooth out the indicator’s curve and allows traders to easily recognize market trends and reversal points.
Meaning of the Stochastic indicator
The Stochastic indicator can be used to identify price trends and reversal points. When %K and %D move above 80, the trend is considered overbought and may be about to reverse to the downside. Conversely, when %K and %D move below 20, the trend is considered oversold and may be about to reverse to the upside.
These are the basic signals of the Stochastic indicator. However, to make accurate trading decisions, traders need to combine it with other analytical tools and monitor market fluctuations.
Benefits of using the Stochastic indicator
The Stochastic indicator has several benefits:
- Can be used to identify price trends and reversal points.
- Can be used to determine support and resistance levels.
- Helps traders easily recognize entry and exit points at the appropriate time.
- Helps minimize risks and optimize profits in trading.
How to read and understand the Stochastic indicator
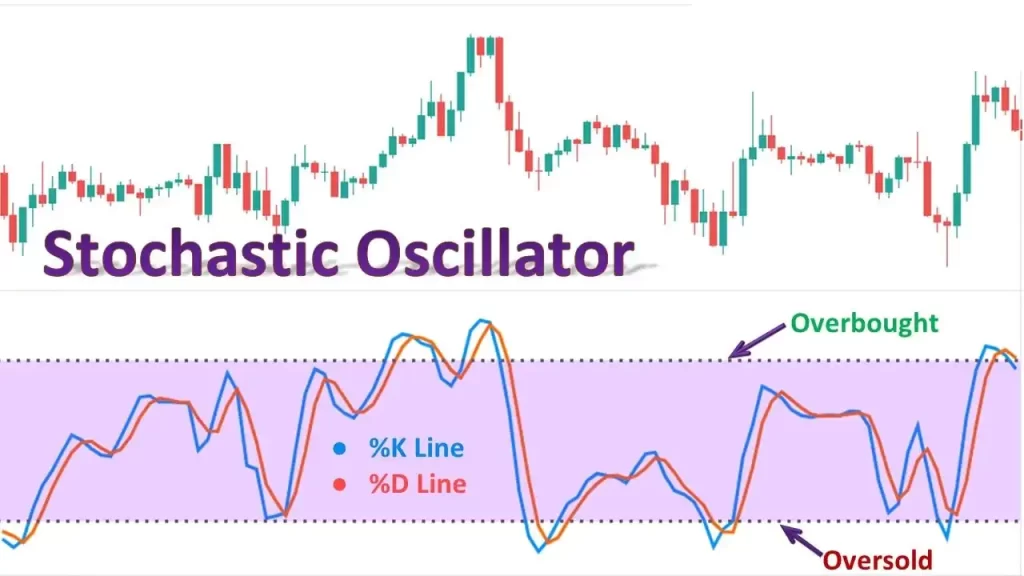
To read and understand the Stochastic indicator, we need to consider three main factors: the %K line, the %D line, and the 80/20 level.
- %K line: Usually drawn as a curve and moves between 0 and 100 levels. When %K crosses %D from above, this is a sell signal. Conversely, when %K crosses %D from the bottom up, this is a buy signal.
- %D line: Usually drawn as a straight line and moves between 0 and 100. When %D crosses the 80 level from above, this is a sell signal. On the contrary, when %D crosses level 20 from the bottom up, this is a buy signal.
- Level 80/20: These are important levels to determine price trends and reversal points. When the Stochastic indicator moves above 80, the market is considered overbought and may be about to reverse. Conversely, when the Stochastic indicator moves below 20, the market is considered oversold and may be about to reverse to the upside.
Ways to use the Stochastic indicator in trading

There are many ways to use the Stochastic indicator in forex trading. Here are some popular ways:
1. Use the Stochastic indicator to identify trends and reversal points
The Stochastic indicator can help traders identify price trends and reversal points. When %K and %D move above 80, the trend is considered overbought and may be about to reverse to the downside. Conversely, when %K and %D move below 20, the trend is considered oversold and may be about to reverse to the upside.
For example: If the Stochastic indicator shows that %K and %D are moving above level 80 and starting to cross each other from above, this is a sell signal. Conversely, if the Stochastic indicator shows that %K and %D are moving below level 20 and starting to cross each other from the bottom up, this is a buy signal.
2. Use the Stochastic indicator to determine support and resistance levels
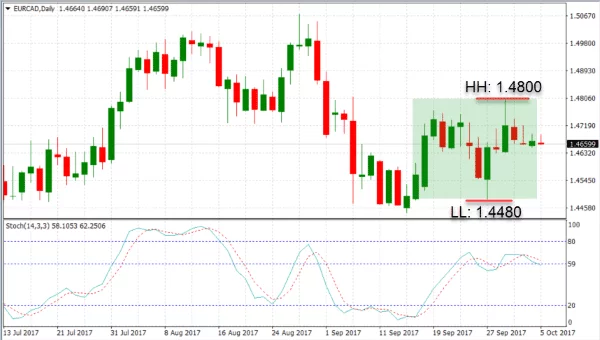
The Stochastic indicator can also help identify support and resistance levels in the market. When the Stochastic indicator moves above 80, this is a strong support level and will likely help keep prices from falling further. Conversely, when the Stochastic indicator moves below 20, this is a strong resistance level and will likely prevent the price from moving higher.
3. Use the Stochastic indicator to determine entry points
The Stochastic indicator can help traders determine entry points at the appropriate time. For example: If the Stochastic indicator shows that %K and %D are moving below level 20 and starting to cross each other from the bottom up, this is a buy signal. Conversely, if the Stochastic indicator shows that %K and %D are moving above level 80 and starting to cross each other from above, this is a sell signal.
Common mistakes when using the Stochastic indicator
Although the Stochastic indicator has many benefits, there are also some common mistakes when using it. Here are those mistakes and how to avoid them:
1. Use the Stochastic indicator alone
One of the common mistakes when using the Stochastic indicator is using it alone, that is, not combined with other analysis tools. This can lead to making incorrect trading decisions and increase risk.
2. Not considering the timing of the indicator
The Stochastic indicator is calculated based on the closing price of an asset over a certain period of time. Therefore, without considering the indicator’s timing, traders can be misled by fake signals.
3. Not considering the general market condition
Another mistake is not considering the general market condition when using the Stochastic indicator. The market may be in an uptrend but the Stochastic indicator gives a sell signal, and vice versa. Therefore, it is necessary to combine with other analytical tools to make accurate trading decisions.
Trading strategies with the Stochastic indicator
Here are some popular trading strategies using the Stochastic indicator:
1. Trend trading strategy
This strategy uses the Stochastic indicator to determine trends and entry points according to the trend. When the Stochastic indicator gives a buy signal (when %K and %D cross each other from the bottom up) in an uptrend, or a sell signal (when %K and %D cross each other from the top down) in a downtrend, then this is the entry point.
2. Support and resistance trading strategy
This strategy uses the Stochastic indicator to identify support and resistance levels in the market. When the Stochastic indicator moves above 80, this is a strong support level and will likely help keep prices from falling further. Conversely, when the Stochastic indicator moves below 20, this is a strong resistance level and will likely prevent the price from moving higher.
3. Trading strategy based on entry point
This strategy uses the Stochastic indicator to determine entry points at the appropriate time. When the Stochastic indicator gives a buy signal (when %K and %D cross each other from the bottom up) or a sell signal (when %K and %D cross each other from the top down), this is the entry point.
Compare the Stochastic indicator with other indicators
The Stochastic indicator can be compared with other indicators such as RSI (Relative Strength Index) and MACD (Moving Average Convergence Divergence). Each indicator has its own characteristics and can be suitable for different trading strategies.
- RSI: Both indicators are used to determine the overbought and oversold levels of the market. However, RSI can give signals earlier than Stochastic.
- MACD: Both indicators are used to determine trends and entry points. However, MACD can give more accurate signals in markets with clear trends.
Conclude
The Stochastic indicator is an important tool in technical analysis and can help traders identify trends and entry points at the right time. However, to effectively use this indicator, it is necessary to combine it with other analytical tools and should not rely too much on it when making trading decisions. In addition, it is necessary to avoid common mistakes when using the Stochastic indicator to ensure successful trading and minimize risks.