
Forex is the world’s largest foreign exchange market, with billions of dollars traded every day. To be able to invest effectively in this market, investors need to master technical analysis tools, including trend lines. In this article, we will learn about trend lines in Forex, how to draw them, their definitions, and the benefits of using them.
Table of contents
- Recognizing trend lines in Forex
- How to draw trend lines
- Trendline definition
- Characteristics of trend lines
- Difference between trend line and price channel
- Tools to identify trend lines
- Benefits of identifying trend lines
- Time and time frame in drawing trend lines
- Factors affecting trend lines
- Trendline-based trading strategies
- Conclude
Recognizing trend lines in Forex

A trend line is a technical analysis tool used to determine the current trend of the market. Trend lines are drawn by connecting the tops or bottoms of prices in a certain trend. There are two main types of trend lines:
- Uptrend line: connects higher lows together.
- Downtrend line: connects lower peaks together.
Trend lines can help investors identify the main trend of the market and make appropriate trading decisions.
How to draw trend lines

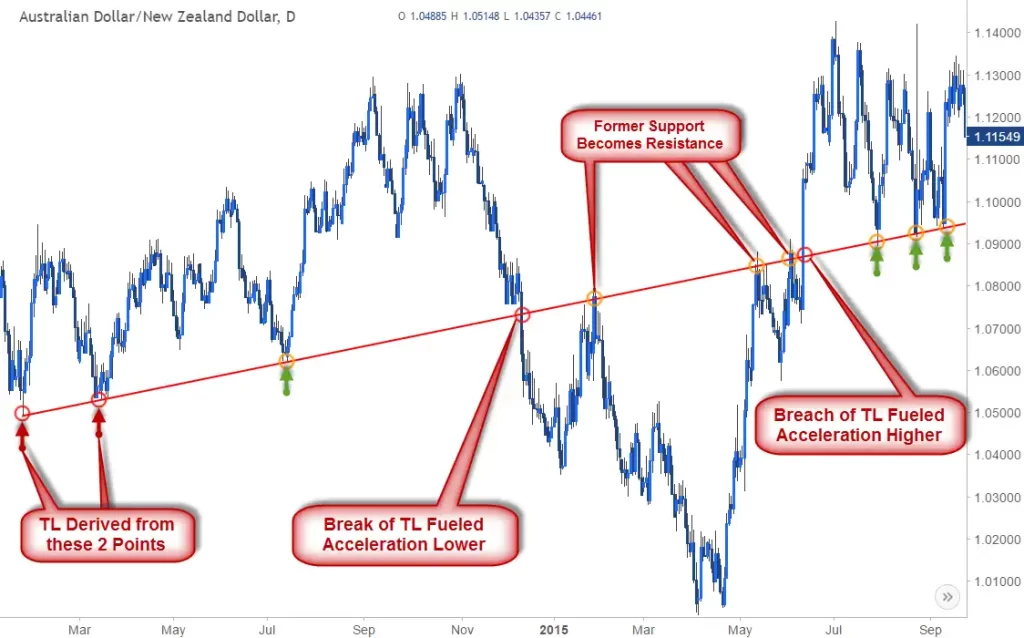
To draw a trend line, it is necessary to identify at least two points on the price chart. These points can be the tops or bottoms of the price. After identifying two points, you need to connect them together with a straight line. This straight line is the trend line.
For example: In the chart below, we can clearly see the rising trend line of the EUR/USD pair. This trend line is drawn by connecting the higher lows of the price.
![How To Draw Trend Lines Perfectly Every Time [2022 Update]](https://dailypriceaction.com/wp-content/uploads/2014/09/how-to-use-trend-lines.png)
Trendline definition
A trend line is a straight line drawn on a price chart to determine the current trend of the market. Trend lines are used to identify support and resistance levels, as well as to predict future price direction.
Trend lines can help investors identify buying and selling points in trading. If the trend line is rising, investors can open a buy order when the price reaches the support level and close the order when the price reaches the resistance level. Conversely, if the trend line is falling, investors can open a sell order when the price reaches the resistance level and close the order when the price reaches the support level.
Characteristics of trend lines
Trend lines have some of the following properties:
- Trend lines can be straight or curved.
- Trend lines can be drawn using various technical analysis tools, such as moving averages or Bollinger Bands.
- Trend lines can be used in any time frame, from short-term to long-term.
Difference between trend line and price channel
Trend lines and price channels are two technical analysis tools used to determine the current trend of the market. However, they have some differences as follows:
- A trend line is a straight line drawn by connecting the tops or bottoms of prices in a certain trend. Meanwhile, a price channel is a price range between two parallel lines, one above and one below.
- Trend lines only tell us the main trend of the market, while price channels also tell us the support and resistance levels within that trend.
- Trend lines can be straight or curved, while price channels are always parallel lines.
Tools to identify trend lines
To identify trend lines, the following technical analysis tools can be used:
Moving Average
Moving averages are a technical analysis tool used to smooth trend lines and help investors easily identify major market trends. Moving averages can be simple moving averages (SMA) or moving averages (EMA).
Bollinger Bands line
Bollinger Bands are a technical analysis tool used to identify support and resistance levels within trends. This line is drawn by connecting the highest highs or lowest lows of the price over a certain period of time.
Parabolic SAR line
The Parabolic SAR is a technical analysis tool used to identify trend reversal points. This line is drawn with points on the chart, telling us where to buy and sell in a trade.
Benefits of identifying trend lines
Identifying trend lines can bring many benefits to investors, including:
- Helps investors identify main market trends and make appropriate trading decisions.
- Allows investors to identify buying and selling points in transactions.
- Helps investors easily identify support and resistance levels in trends.
- Can be applied to any currency pair and in any timeframe.
Time and time frame in drawing trend lines
Trend lines can be used in any time frame, from short-term to long-term. However, to be able to recognize the main trend of the market, you should use a longer time frame, for example 1 hour or 4 hours.
In addition, it should be noted that trend lines can change over time, so it is necessary to regularly update and readjust the trend line when necessary.
Factors affecting trend lines
Trend lines can be influenced by many factors, including:
- Economic and political news: Economic and political information can affect market trends and change trend lines.
- Price volatility: If prices move too fast or too slow, the trend line may be misaligned and need to be adjusted.
- Market distribution: When the market distribution is unbalanced, the trend line may reverse.
Trendline-based trading strategies
There are many trading strategies based on trend lines, for example:
- Trend trading: Open a buy order when the price reaches the support level and close the order when the price reaches the resistance level in an uptrend. Conversely, open a sell order when the price reaches the resistance level and close the order when the price reaches the support level in a downtrend.
- Reversal Points: Reversal points occur when the trend line reverses and the price moves in the opposite direction. Investors can open orders according to this strategy when they recognize the trend line’s reversal point.
- Trading within the price channel: When the price fluctuates within the price channel, investors can open a buy order when the price reaches the support level and close the order when the price reaches the resistance level.
Conclude
In this article, we learned about trend lines in Forex, how to draw them, their definitions and the benefits of using them. Trend lines are an important technical analysis tool to identify major market trends and help investors make effective trading decisions. However, it should be noted that trend lines can be influenced by many factors and need to be adjusted regularly to ensure accuracy.