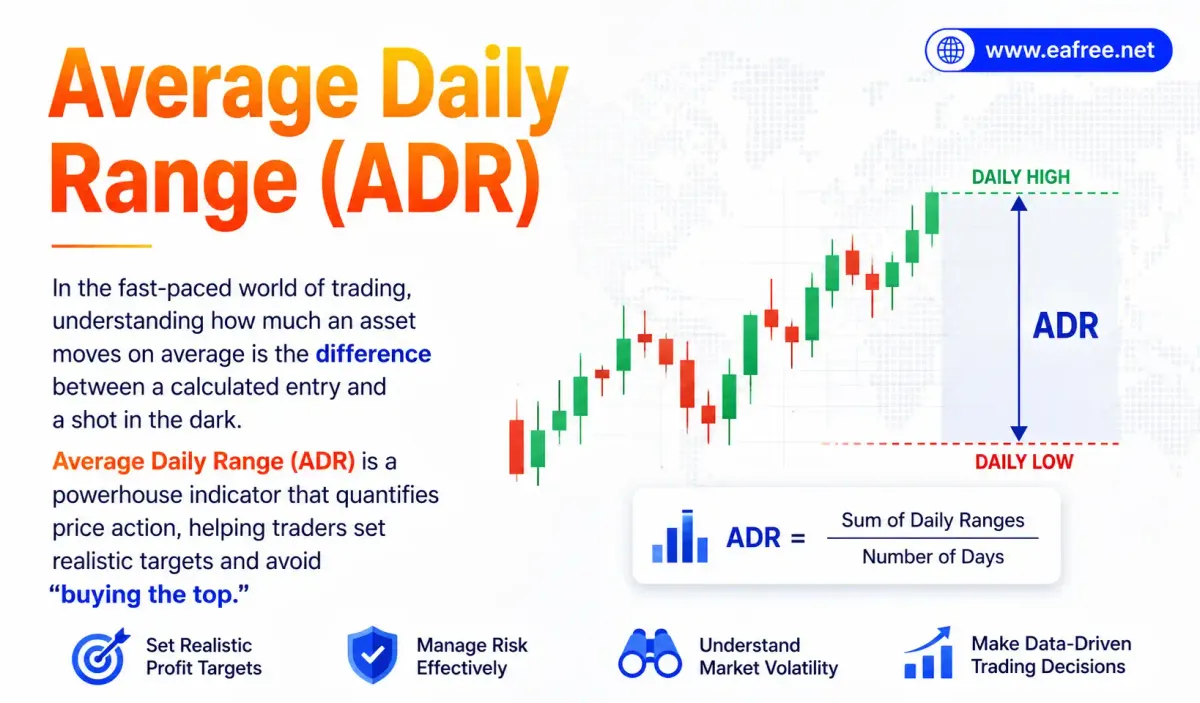
In the fast-paced world of trading, understanding how much an asset moves on average is the difference between a calculated entry and a shot in the dark. Average Daily Range (ADR) is a powerhouse indicator that quantifies price action, helping traders set realistic targets and avoid "buying the top."
What is Average Daily Range (ADR)?
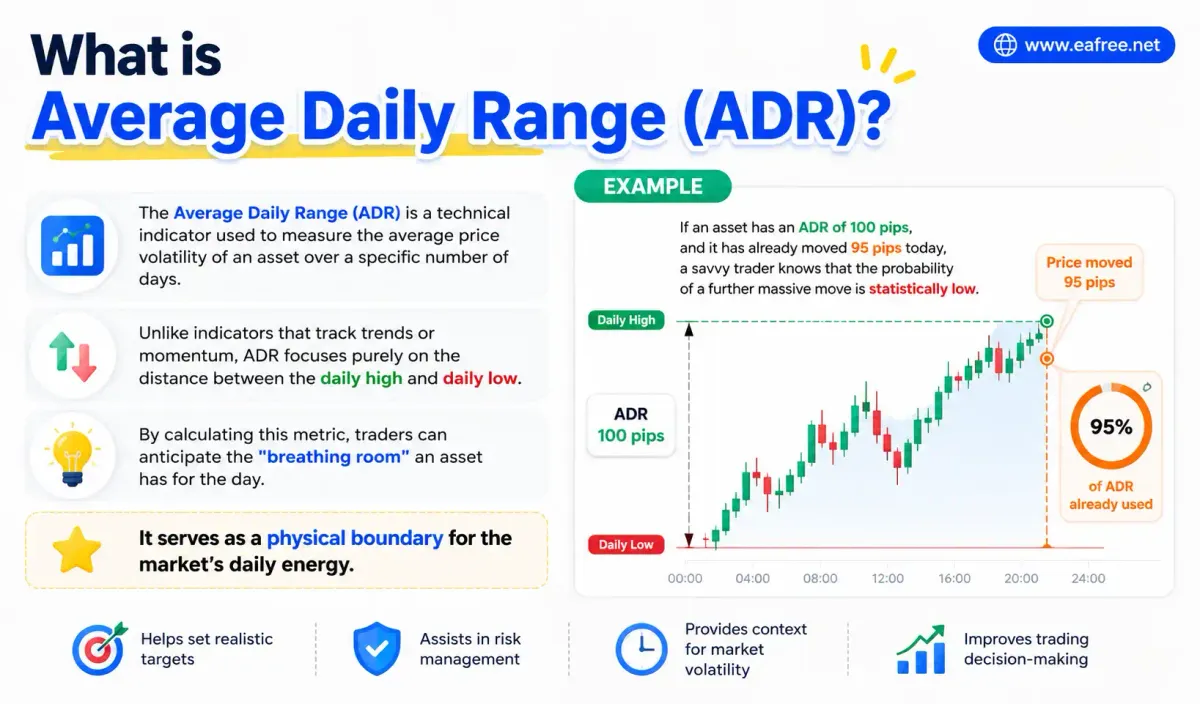
The Average Daily Range (ADR) is a technical indicator used to measure the average price volatility of an asset over a specific number of days. Unlike indicators that track trends or momentum, ADR focuses purely on the distance between the daily high and daily low. By calculating this metric, traders can anticipate the "breathing room" an asset has for the day.
For example, if an asset has an ADR of 100 pips, and it has already moved 95 pips today, a savvy trader knows that the probability of a further massive move is statistically low. It serves as a physical boundary for the market’s daily energy.
The Mathematical Formula for ADR
To master ADR, you must understand how the numbers are crunched. While most platforms like TradingView or MT4 calculate this automatically, knowing the formula helps you customize the lookback period to fit your trading style (e.g., a 5-day ADR for short-term scalp or a 20-day ADR for swing trading).
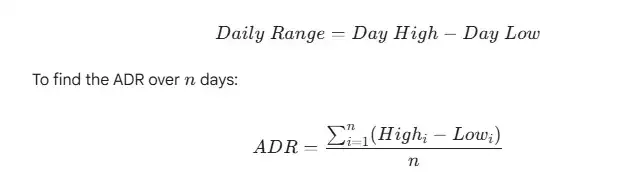
The basic formula for a single day's range is:
//Comparison: ADR vs. ATR
Many traders confuse ADR with Average True Range (ATR). While similar, they have a key distinction:
- ADR: Only measures the distance between the high and low of the sessions.
- ATR: Includes "gaps" between sessions, making it more common in volatile stock markets where overnight gaps occur frequently.
Why Every Trader Needs ADR in Their Toolkit
Trading without ADR is like driving a car without a fuel gauge; you have no idea when the momentum might run dry. ADR provides a statistical baseline that removes emotional guesswork from the equation.
By observing the ADR, you gain three immediate advantages:
- Volatility Awareness: You know if the market is currently "quiet" or "explosive."
- Realistic Expectations: You won't aim for a 200-pip profit on a pair that only moves 80 pips a day.
- Risk Management: It helps in placing stop-losses outside the "noise" of normal daily fluctuations.
How to Calculate ADR: A Step-by-Step Example
Let's look at a practical example using a 5-day period for a stock or Forex pair. This short-term ADR is excellent for capturing recent shifts in market sentiment.
| Day | Daily High | Daily Low | Range (High - Low) |
| Day 1 | 150.00 | 148.50 | 1.50 |
| Day 2 | 149.80 | 147.20 | 2.60 |
| Day 3 | 152.00 | 150.00 | 2.00 |
| Day 4 | 151.50 | 149.00 | 2.50 |
| Day 5 | 153.00 | 151.60 | 1.40 |
| Total | 10.00 |
Calculation: $10.00 / 5\ days = 2.00$
The ADR (5) is 2.00. This means on any given day, you can expect the price to fluctuate by roughly 2 units from its low to its high.
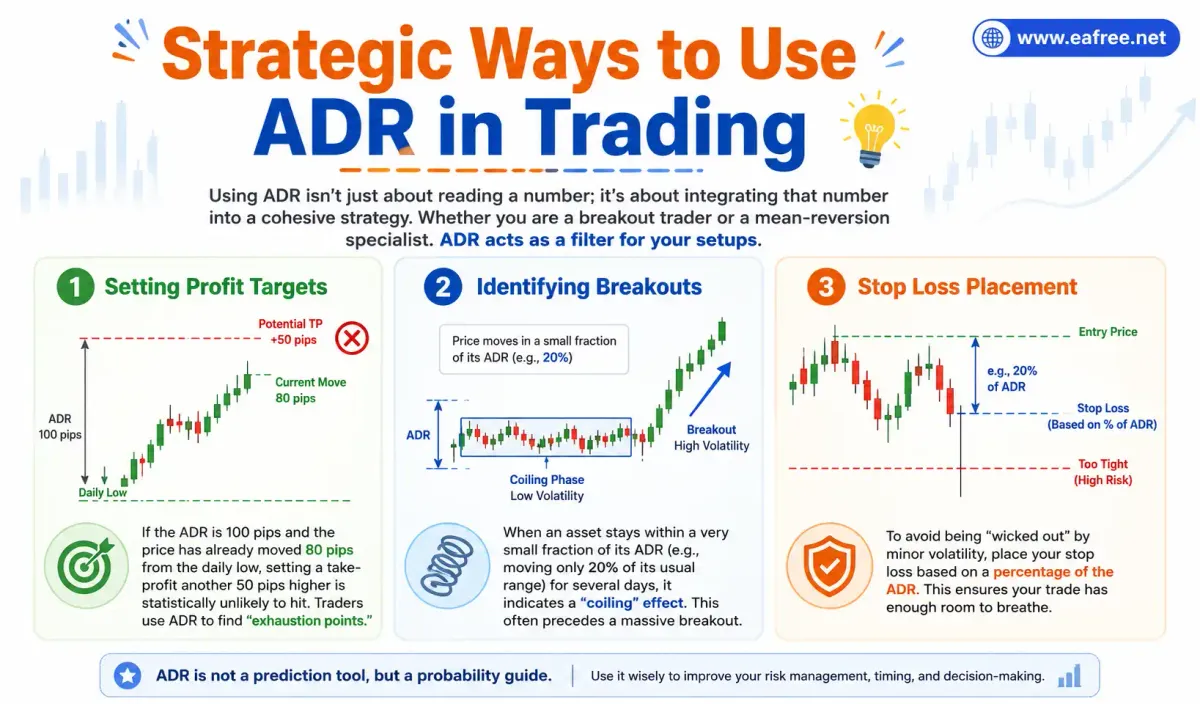
Strategic Ways to Use ADR in Trading
Using ADR isn't just about reading a number; it’s about integrating that number into a cohesive strategy. Whether you are a breakout trader or a mean-reversion specialist, ADR acts as a filter for your setups.
//1. Setting Profit Targets
If the ADR is 100 pips and the price has already moved 80 pips from the daily low, setting a take-profit another 50 pips higher is statistically unlikely to hit. Traders use ADR to find "exhaustion points."
//2. Identifying Breakouts
When an asset stays within a very small fraction of its ADR (e.g., moving only 20% of its usual range) for several days, it indicates a "coiling" effect. This often precedes a massive breakout.
//3. Stop Loss Placement
To avoid being "wicked out" by minor volatility, place your stop loss based on a percentage of the ADR. This ensures your trade has enough room to breathe.
Common ADR Values for Popular Assets
Different assets have different "personalities." A tech stock will have a much higher ADR percentage than a utility stock, and GBP/JPY (the "Dragon") will always have a higher ADR than EUR/CHF.
| Asset Class | Ticker | Typical ADR (Pips/Points) | Volatility Level |
| Forex | EUR/USD | 70 - 90 | Medium |
| Forex | GBP/JPY | 120 - 160 | High |
| Indices | S&P 500 | 40 - 60 | Medium |
| Crypto | Bitcoin | 1500 - 3000 | Extreme |
Note: These values shift based on market cycles (Bull vs. Bear). Always check the current 14-day ADR for the most accurate data.
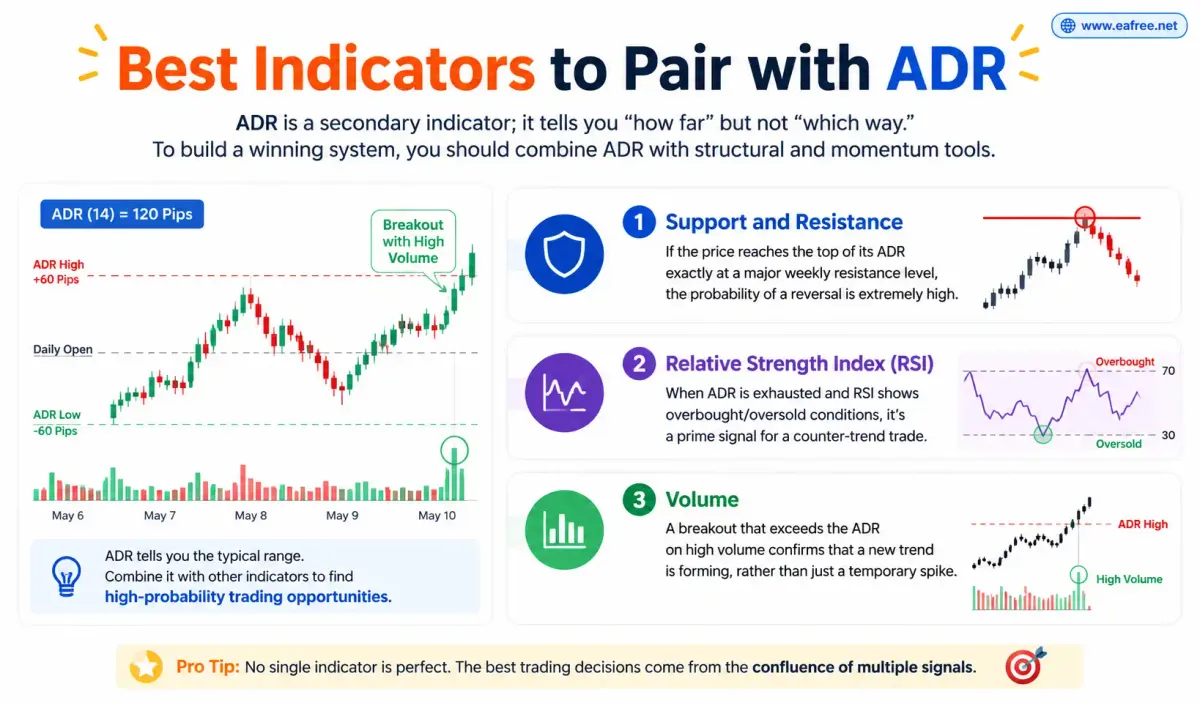
Best Indicators to Pair with ADR
ADR is a secondary indicator; it tells you "how far" but not "which way." To build a winning system, you should combine ADR with structural and momentum tools.
- Support and Resistance: If the price reaches the top of its ADR exactly at a major weekly resistance level, the probability of a reversal is extremely high.
- Relative Strength Index (RSI): When ADR is exhausted and RSI shows overbought/oversold conditions, it’s a prime signal for a counter-trend trade.
- Volume: A breakout that exceeds the ADR on high volume confirms that a new trend is forming, rather than just a temporary spike.
ADR Limitations and Risks
While ADR is a vital tool, it is not a crystal ball. Relying solely on historical averages can be dangerous during "Black Swan" events or major news releases like the NFP (Non-Farm Payrolls) or Interest Rate decisions.
During high-impact news, an asset can easily move 2x or 3x its ADR. In these cases, the ADR acts as a floor rather than a ceiling. It is also a "lagging" indicator because it uses past data to project future movement. If the market environment changes from low volatility to high volatility overnight, the ADR will take several days to catch up.
Summary: Mastering the Range
The Average Daily Range is one of the simplest yet most effective tools for maintaining trading discipline. By respecting the statistical limits of the market, you protect your capital from over-extension and increase the hit rate of your profit targets.
FAQs
❓ What is a "good" ADR for day trading?
There is no single "good" number, but many day traders look for assets with an ADR of at least 1% of the asset's price (or 80+ pips in Forex). This ensures there is enough movement to cover spreads and commissions while leaving room for profit.
❓ Should I use a 5-day or 20-day ADR?
A 5-day ADR is better for volatile markets as it reacts quickly to recent news. A 20-day ADR provides a smoother, more stable average that is better for swing traders looking for long-term consistency.
❓ Can ADR be used on intraday timeframes like 15-minute charts?
Yes. Even if you trade on a 15-minute chart, the ADR (which is based on Daily data) tells you where the daily boundaries are. It helps intraday traders know if they are buying at the "top" of the day's expected range.
❓ Does a high ADR mean a stock is a good buy?
Not necessarily. A high ADR simply means the stock is volatile. While this offers more profit potential, it also carries significantly higher risk. High ADR stocks require wider stop-losses.
❓ What happens when price exceeds the ADR?
When price moves beyond its 100% ADR, it is considered "extended." It will either lead to a blow-off top/reversal or, if supported by massive volume, indicate the start of a rare, powerful new trend.