Introduction
In the world of trading, volume plays a crucial role in confirming trends and identifying potential market reversals. While price movements often take center stage, understanding the strength behind those movements is equally important. This is where the Volume Oscillator comes in.
The Volume Oscillator is a simple yet powerful technical indicator that helps traders analyze the relationship between short-term and long-term volume trends. Whether you are a beginner or an experienced trader, mastering this tool can significantly improve your decision-making process.
In this guide, we will break down how the Volume Oscillator works, how to interpret it, and how you can use it effectively in your trading strategy.
What Is the Volume Oscillator?
The Volume Oscillator is a momentum-based indicator that measures the difference between two moving averages of trading volume. It helps traders understand whether volume is increasing or decreasing over time.
Instead of looking at raw volume data—which can be noisy—the oscillator smooths it out and highlights meaningful changes in market participation.
//Key Idea:
- Rising oscillator → Increasing volume momentum
- Falling oscillator → Decreasing volume momentum
This makes it easier to spot when trends are gaining strength or losing steam.
How the Volume Oscillator Works
The Volume Oscillator is calculated by comparing a short-term moving average of volume with a long-term moving average.
//Formula:
Volume Oscillator = Short-Term Volume MA − Long-Term Volume MA
Some traders also use a percentage-based version:
Volume Oscillator (%) =
((Short-Term MA − Long-Term MA) / Long-Term MA) × 100
//Common Settings:
- Short-term MA: 5 to 14 periods
- Long-term MA: 20 to 50 periods
These settings can be adjusted depending on your trading style:
- Short-term traders prefer faster settings
- Swing traders prefer smoother, longer settings
Why Volume Matters in Trading
Before diving deeper, it's important to understand why volume is so critical.
Volume reflects the number of participants in a market. When price moves with high volume, it suggests strong conviction. When price moves with low volume, the move may be weak or unreliable.
//Example:
- Price rises + high volume → Strong uptrend
- Price rises + low volume → Weak or false breakout
The Volume Oscillator helps visualize this relationship clearly.
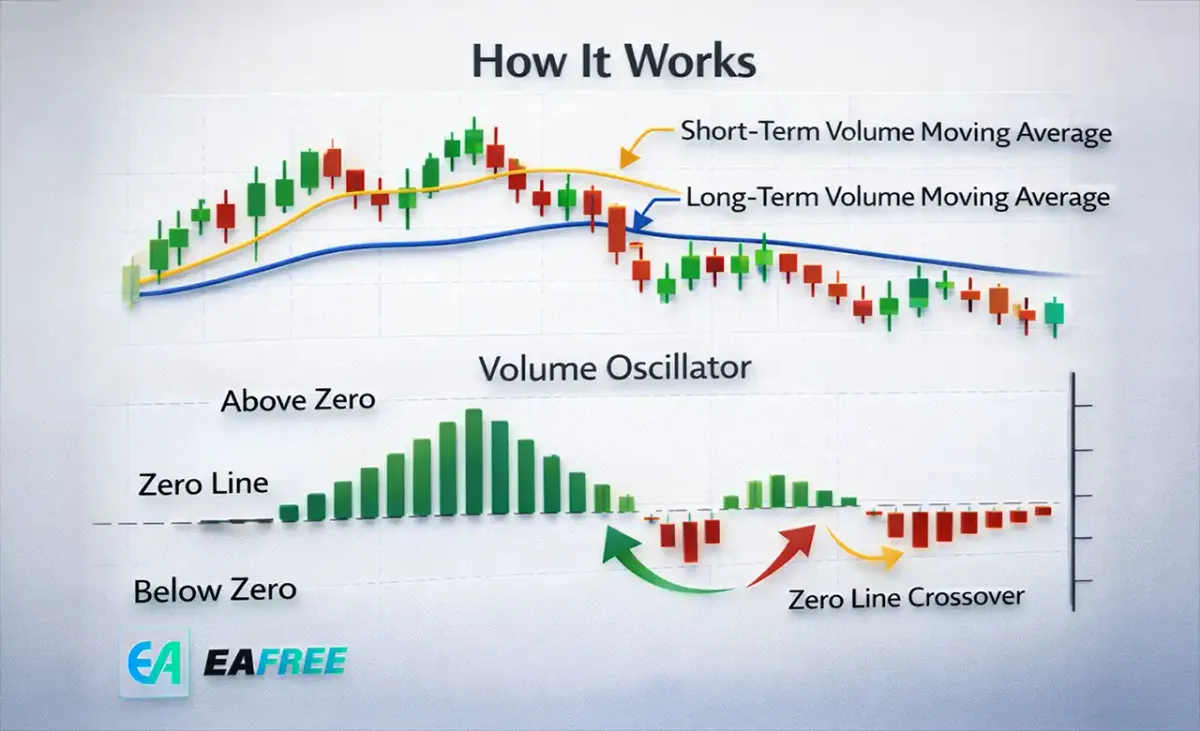
How to Read the Volume Oscillator
The oscillator typically fluctuates above and below a zero line.
//1. Above Zero Line
When the oscillator is above zero:
- Short-term volume is higher than long-term volume
- Indicates increasing market activity
- Often supports ongoing trends
//2. Below Zero Line
When the oscillator is below zero:
- Short-term volume is lower than long-term volume
- Indicates declining interest
- May signal weakening trends
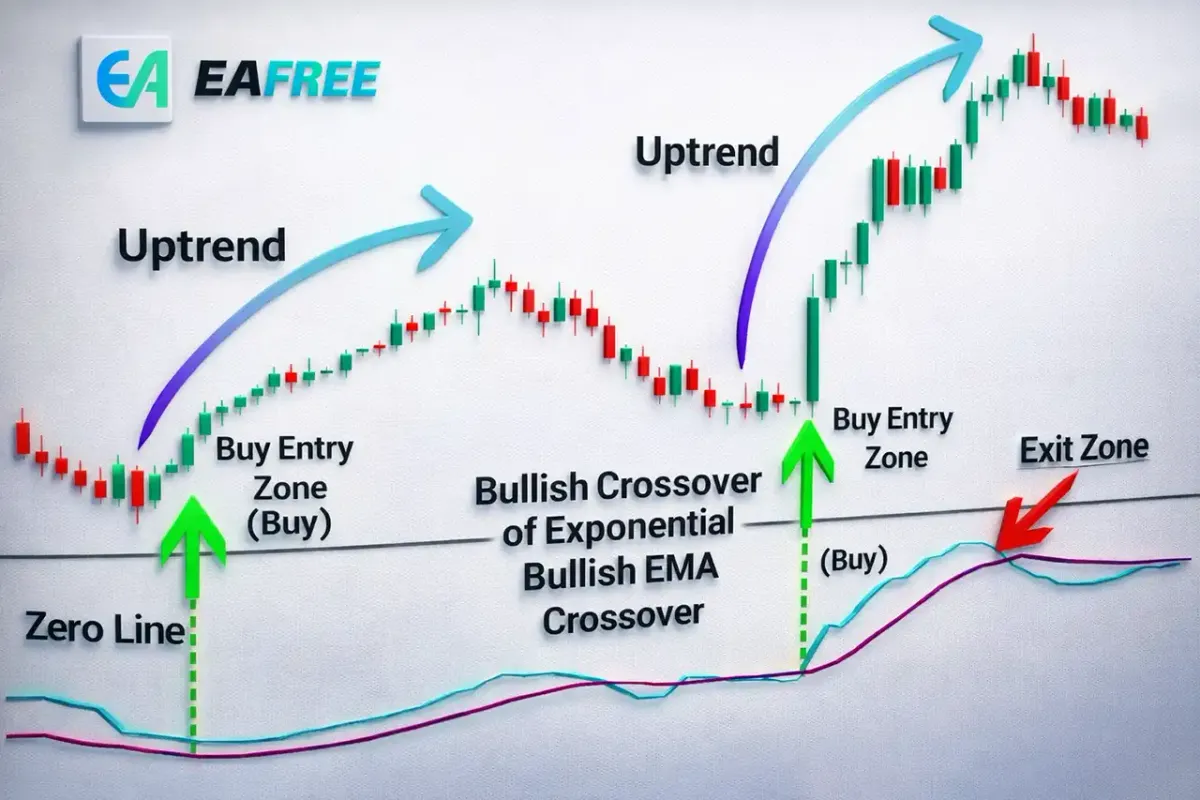
//3. Crossing the Zero Line
Zero-line crossovers are important signals:
- Crossing above zero → Potential bullish confirmation
- Crossing below zero → Potential bearish confirmation
Key Trading Signals
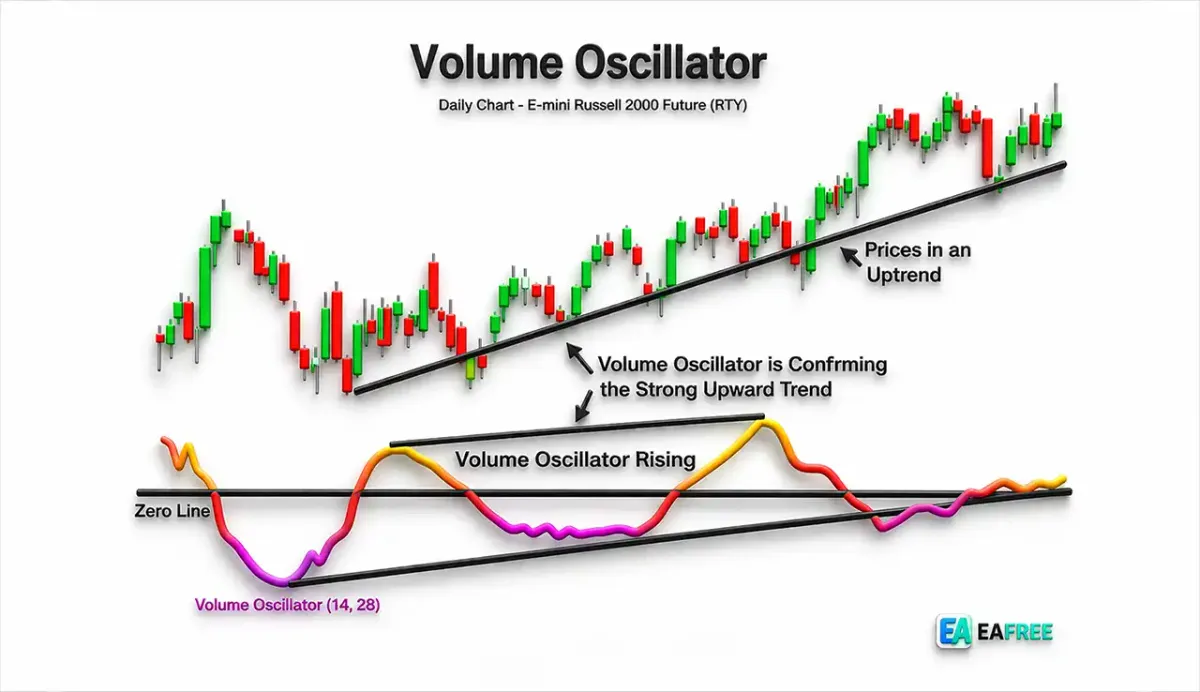
//1. Trend Confirmation
One of the most common uses of the Volume Oscillator is confirming trends.
- Uptrend + rising oscillator → Strong bullish trend
- Downtrend + falling oscillator → Strong bearish trend
If price is moving but the oscillator disagrees, it could be a warning sign.
//2. Divergence Signals
Divergence occurs when price and the oscillator move in opposite directions.
Bullish Divergence:
- Price makes lower lows
- Oscillator makes higher lows
→ Possible upward reversal
Bearish Divergence:
- Price makes higher highs
- Oscillator makes lower highs
→ Possible downward reversal
Divergences are powerful but should always be confirmed with other indicators.
//3. Breakout Confirmation
When price breaks out of a key level:
- Strong volume (rising oscillator) confirms the breakout
- Weak volume (falling oscillator) suggests a false breakout
This can help traders avoid traps and enter more reliable trades.
Advantages of the Volume Oscillator
//1. Simple and Easy to Use
The indicator is straightforward and beginner-friendly.
//2. Improves Trend Analysis
It adds depth to price action by incorporating volume.
//3. Works Across Markets
You can use it in:
- Stocks
- Forex
- Cryptocurrencies
- Commodities
//4. Helps Avoid False Signals
Volume confirmation reduces the risk of entering weak trades.
Limitations You Should Know
No indicator is perfect, and the Volume Oscillator has its drawbacks.
//1. Lagging Nature
Since it uses moving averages, it reacts after changes occur.
//2. Not a Standalone Tool
It works best when combined with:
- Support and resistance
- Trendlines
- Other indicators like RSI or MACD
//3. Sensitive to Settings
Different settings can produce different signals, so optimization is important.
Best Strategies Using Volume Oscillator
//Strategy 1: Trend Following
- Identify the trend using price action
- Confirm with Volume Oscillator:
- Above zero → Buy setups
- Below zero → Sell setups
- Enter on pullbacks
//Strategy 2: Breakout Trading
- Mark key resistance/support levels
- Wait for breakout
- Check oscillator:
- Rising → Valid breakout
- Falling → Avoid trade
//Strategy 3: Divergence Trading
- Look for divergence between price and oscillator
- Wait for confirmation (candlestick pattern or support/resistance)
- Enter trade with proper risk management
Tips for Using Volume Oscillator Effectively
- Combine with price action for better accuracy
- Avoid trading in low-volume markets
- Adjust settings based on timeframe
- Use stop-loss to manage risk
- Backtest before applying in live trading
Volume Oscillator vs Other Volume Indicators
//Volume Oscillator vs On-Balance Volume (OBV)
- Volume Oscillator: Focuses on moving average differences
- OBV: Tracks cumulative volume flow
//Volume Oscillator vs Volume Bars
- Oscillator: Smoothed and easier to interpret
- Volume Bars: Raw data, more detailed but noisier
Each tool has its own strengths, and combining them can provide deeper insights.
Common Mistakes Traders Make
//1. Ignoring Market Context
The oscillator should not be used in isolation.
//2. Overtrading Signals
Not every crossover is a trade opportunity.
//3. Using Default Settings Blindly
Customize settings based on your strategy.
//4. Ignoring Risk Management
Even strong signals can fail.
Real-World Example
Imagine a stock breaking above resistance:
- Price breaks out
- Volume Oscillator rises sharply above zero
This suggests strong buying interest, increasing the probability of a successful breakout.
On the other hand:
- Price breaks out
- Oscillator stays flat or declines
This could indicate a false breakout, warning traders to stay cautious.
Conclusion
The Volume Oscillator is a valuable tool that helps traders understand the strength behind price movements. By comparing short-term and long-term volume trends, it provides insights that are not visible through price alone.
While it is simple to use, its true power comes from combining it with other technical analysis tools and proper risk management.
If used correctly, the Volume Oscillator can help you:
- Confirm trends
- Identify reversals
- Avoid false breakouts
Start by practicing on demo charts, experiment with different settings, and gradually incorporate it into your trading strategy.