Introduction
If you are just starting your journey in trading or investing, you’ve probably come across dozens of technical indicators that promise to help you make better decisions. Among them, the Moving Average Convergence Divergence (MACD) stands out as one of the most popular and beginner-friendly tools.
MACD is widely used by traders in stocks, forex, and cryptocurrencies to identify trends, momentum, and potential entry or exit points. Despite its intimidating name, MACD is actually quite simple once you break it down.
In this complete beginner’s guide, we will explore what MACD is, how it works, how to interpret it, and how you can start using it effectively in your trading strategy.
What is MACD?
The Moving Average Convergence Divergence (MACD) is a trend-following momentum indicator developed by Gerald Appel in the late 1970s.
It shows the relationship between two moving averages of a security’s price. In simple terms, MACD helps traders answer two important questions:
- Is the trend going up or down?
- Is the momentum getting stronger or weaker?
MACD is especially useful because it combines both trend and momentum, making it more powerful than many single-purpose indicators.
Components of MACD
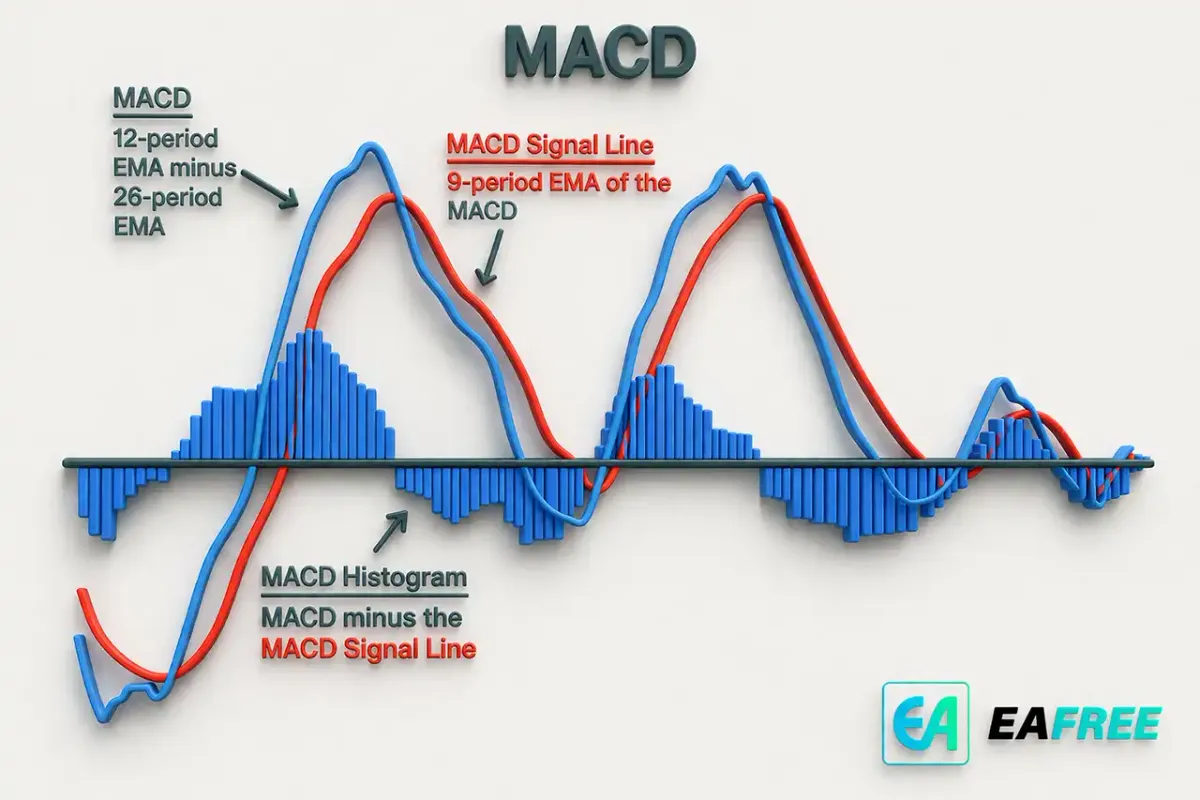
The MACD indicator consists of three main components:
//1. MACD Line
This is the core of the indicator. It is calculated by subtracting the 26-period Exponential Moving Average (EMA) from the 12-period EMA.
Formula:
MACD Line = 12 EMA − 26 EMA
//2. Signal Line
This is a 9-period EMA of the MACD Line. It acts as a trigger for buy and sell signals.
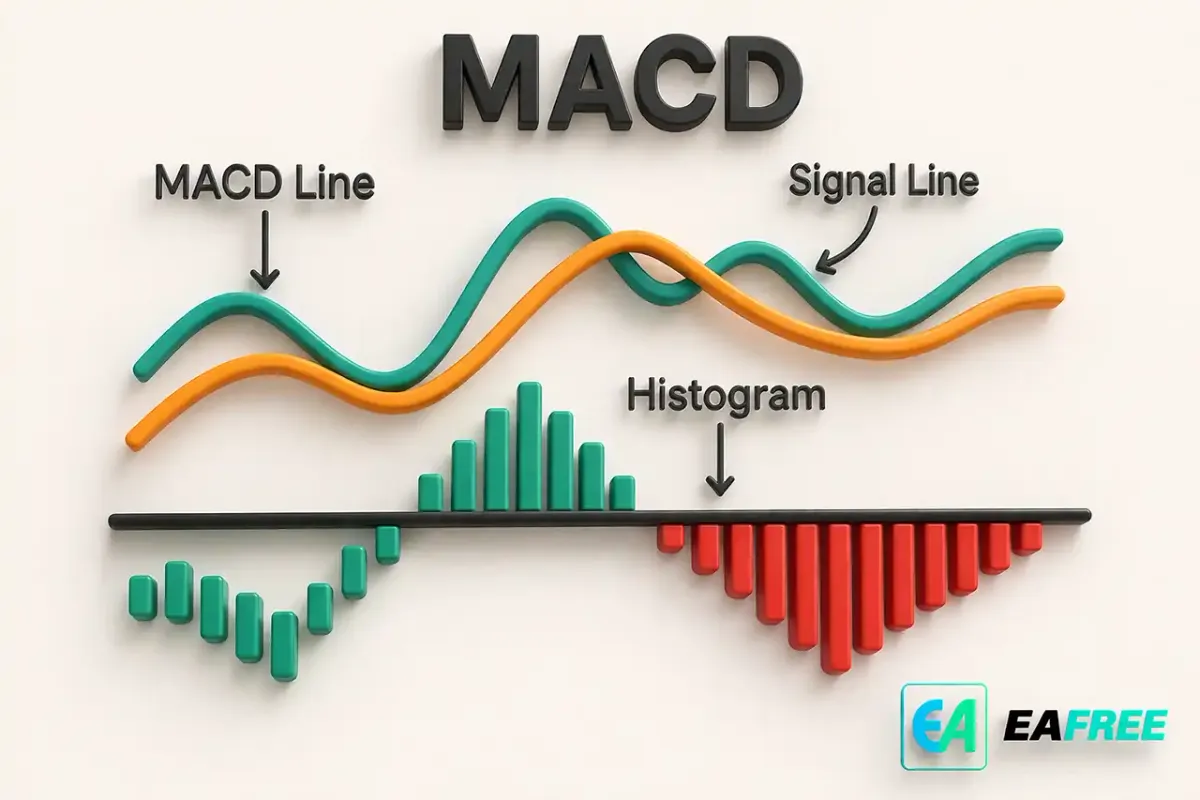
//3. Histogram
The histogram represents the difference between the MACD Line and the Signal Line.
- Positive histogram → bullish momentum
- Negative histogram → bearish momentum
How MACD Works
MACD works by tracking the distance between two moving averages. When the shorter-term EMA moves away from the longer-term EMA, momentum is increasing. When they move closer together, momentum is decreasing.
There are two key concepts behind MACD:
//Convergence
When the two moving averages come closer together, it suggests that momentum is slowing down and a trend reversal might be near.
//Divergence
When the moving averages move apart, it indicates that momentum is increasing and the current trend is strengthening.
How to Read MACD
Understanding how to interpret MACD signals is essential. Let’s break it down into simple, actionable insights.
//1. MACD Line Crossing the Signal Line
This is the most common MACD signal.
- Bullish Signal: MACD line crosses above the signal line
- Bearish Signal: MACD line crosses below the signal line
These crossovers are often used as entry and exit points.
//2. MACD Crossing the Zero Line
The zero line is the point where the MACD Line equals zero.
- Above zero → bullish trend
- Below zero → bearish trend
When MACD crosses above the zero line, it confirms upward momentum. When it crosses below, it signals downward momentum.
//3. Histogram Interpretation
The histogram provides a visual representation of momentum strength.
- Expanding bars → increasing momentum
- Shrinking bars → weakening momentum
A shrinking histogram can be an early warning sign of a trend reversal.
MACD Divergence (Very Important)
One of the most powerful uses of MACD is spotting divergence between price and the indicator.
//Bullish Divergence
- Price makes lower lows
- MACD makes higher lows
This suggests that selling pressure is weakening and a reversal to the upside may occur.
//Bearish Divergence
- Price makes higher highs
- MACD makes lower highs
This indicates weakening buying pressure and a potential downward reversal.
Divergence is not always immediate, but it is a strong signal that momentum is changing.
How to Use MACD in Trading
Now that you understand the basics, let’s look at practical ways to use MACD in real trading scenarios.
//1. Trend Confirmation
Use MACD to confirm the direction of the trend before entering a trade.
- Only look for buy signals when MACD is above zero
- Only look for sell signals when MACD is below zero
This helps you trade with the trend instead of against it.
//2. Entry Strategy
A simple MACD entry strategy:
Buy Setup:
- MACD crosses above signal line
- Histogram turns positive
- Price is in an uptrend
Sell Setup:
- MACD crosses below signal line
- Histogram turns negative
- Price is in a downtrend
//3. Exit Strategy
You can use MACD signals to exit trades:
- Exit when MACD crosses back against your position
- Exit when histogram starts shrinking
- Exit when divergence appears
//4. Combine MACD with Other Indicators
MACD works best when combined with other tools such as:
- Support and Resistance
- Trendlines
- Relative Strength Index (RSI)
- Moving Averages (MA)
Using multiple indicators helps reduce false signals.
Advantages of MACD
MACD is popular for good reason. Here are its key strengths:
//Easy to Understand
Despite its complex name, MACD is visually simple and beginner-friendly.
//Versatile
It works across different markets:
- Stocks
- Forex
- Crypto
//Combines Trend and Momentum
Few indicators provide both trend direction and momentum strength in one tool.
Limitations of MACD
Like any indicator, MACD is not perfect.
//Lagging Indicator
MACD is based on moving averages, so it reacts to past price data. This means signals can come late.
//False Signals in Sideways Markets
In ranging or choppy markets, MACD may produce misleading signals.
//Not Enough on Its Own
Relying solely on MACD can be risky. It should always be combined with other analysis tools.
Common Mistakes Beginners Make
//1. Using MACD Alone
Many beginners rely only on MACD without considering price action or market structure.
//2. Ignoring the Trend
Taking buy signals in a downtrend (or vice versa) can lead to losses.
//3. Overtrading
Not every crossover is a good trade. Quality matters more than quantity.
//4. Misinterpreting Divergence
Divergence does not guarantee an immediate reversal. It is a warning, not a signal.
Pro Tips for Using MACD
- Always analyze the overall trend first
- Use higher timeframes for stronger signals
- Combine MACD with volume indicators
- Be patient and wait for confirmation
- Backtest your strategy before using real money
Example of MACD in Action
Let’s say a stock is in an uptrend:
- MACD is above the zero line
- MACD line crosses above the signal line
- Histogram turns positive
This alignment suggests a strong buying opportunity.
Later:
- Histogram starts shrinking
- MACD line crosses below signal line
This could signal a good time to exit the trade.
Conclusion
The Moving Average Convergence Divergence (MACD) is one of the most powerful and widely used indicators for beginner traders. It provides valuable insights into both trend direction and momentum, making it a versatile tool in any trading strategy.
To summarize:
- MACD helps identify trends and momentum
- Crossovers provide entry and exit signals
- Divergence can signal potential reversals
- It works best when combined with other tools
As a beginner, your goal should not be to find a “perfect” indicator, but to understand how each tool works and how to use it effectively in context.
Start simple, practice consistently, and over time, MACD can become a reliable part of your trading toolkit.