Introduction
In the world of technical analysis, traders rely on a variety of indicators to identify trends, entry points and potential reversals. One of the most widely used trend-following tools is the Parabolic SAR (Stop and Reverse) indicator. Known for its simplicity and visual clarity, the Parabolic SAR helps traders determine the direction of an asset’s price movement and identify optimal moments to enter or exit trades.
In this article, we’ll explore what the Parabolic SAR indicator is, how it works, how to use it effectively, and its advantages and limitations. Whether you are a beginner or an experienced trader, understanding this tool can enhance your trading strategy.
What Is the Parabolic SAR Indicator?
The Parabolic SAR indicator is a technical analysis tool developed by J. Welles Wilder Jr., the same analyst who created other popular indicators such as the Relative Strength Index (RSI) and Average True Range (ATR).
“SAR” stands for Stop and Reverse, which reflects the indicator’s main function: signaling when a trend might be ending and reversing direction.
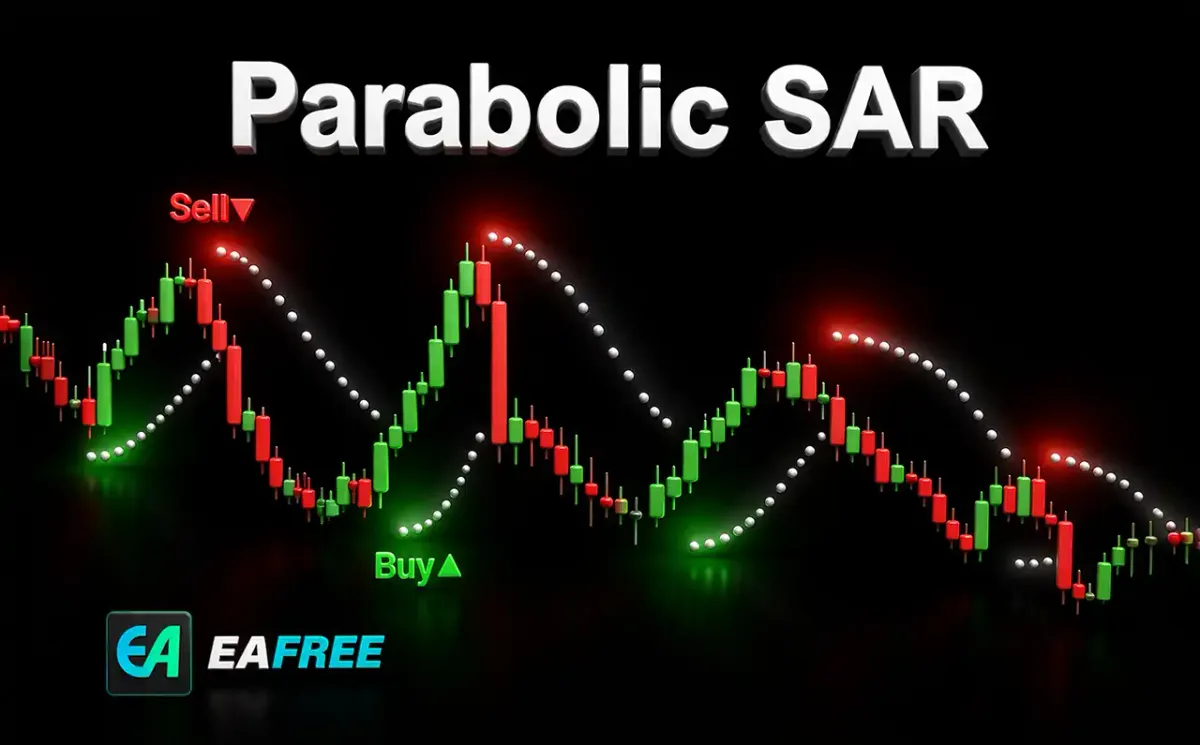
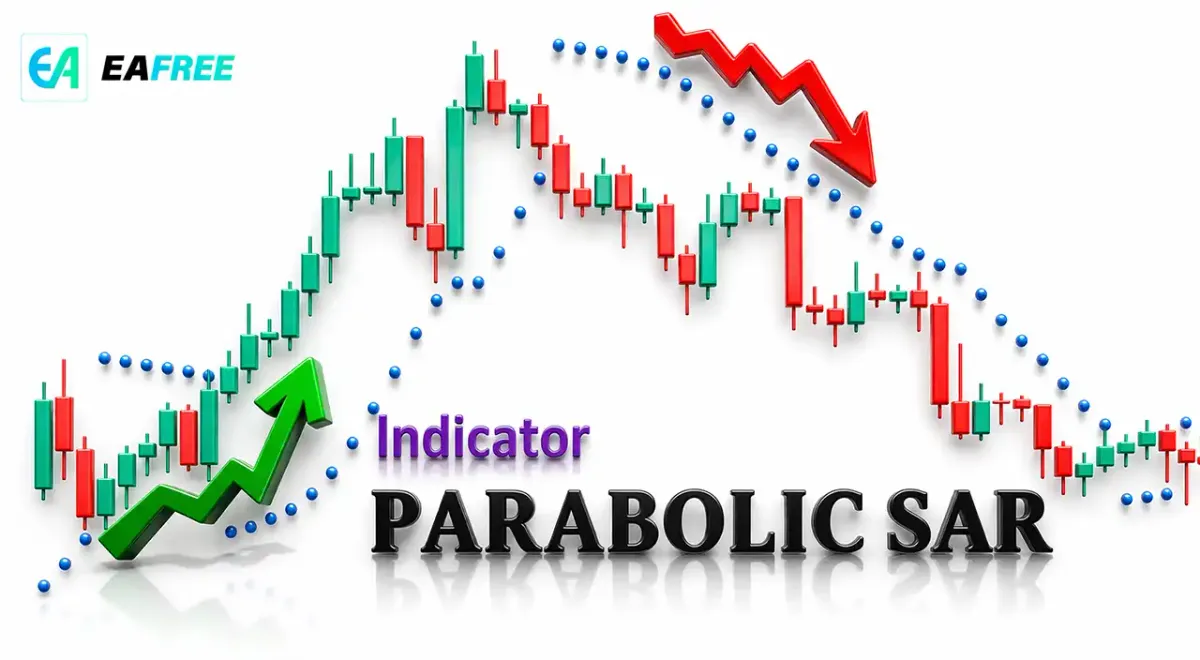
The Parabolic SAR appears on a price chart as a series of dots placed either above or below the price:
- Dots below the price indicate an uptrend (bullish signal)
- Dots above the price indicate a downtrend (bearish signal)
As the trend continues, the dots move closer to the price, forming a parabolic curve—hence the name.
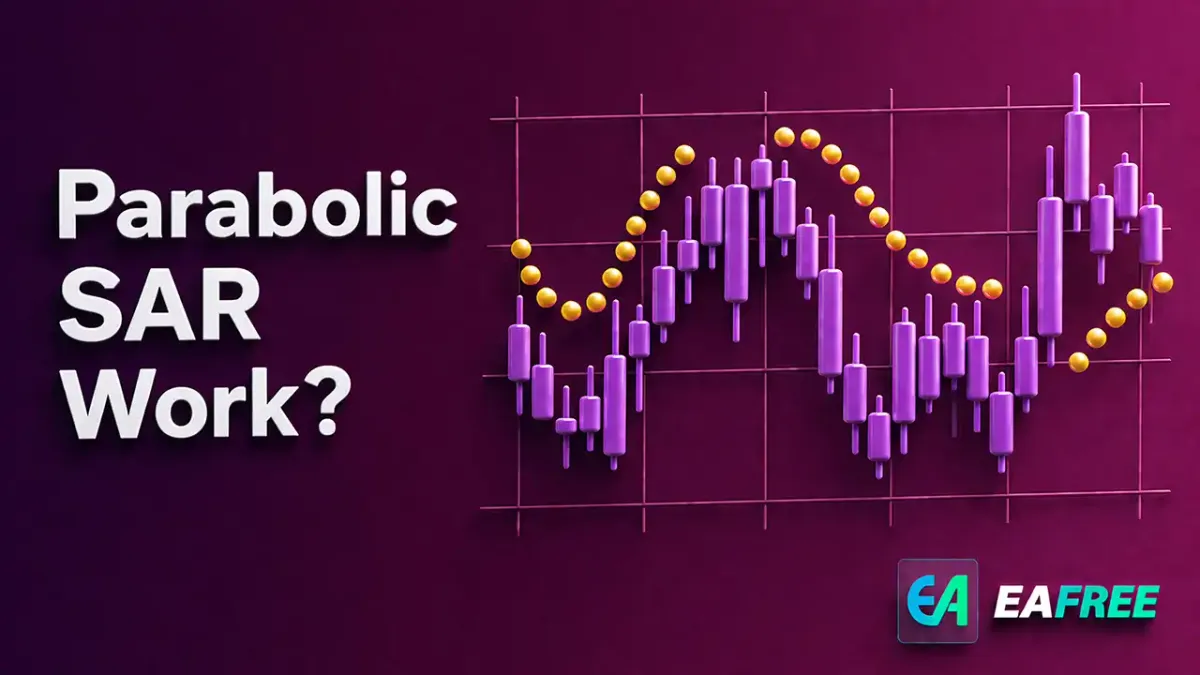
How Does the Parabolic SAR Work?
The Parabolic SAR is designed to track price trends and adjust over time. It uses a mathematical formula that incorporates:
- The current trend direction
- The extreme price (highest high or lowest low)
- An acceleration factor (AF)
//Key Components
- Extreme Point (EP):
- In an uptrend: the highest price reached so far
- In a downtrend: the lowest price reached so far
- Acceleration Factor (AF):
- Starts at a small value (typically 0.02)
- Increases incrementally (e.g., by 0.02) as the trend continues
- Has a maximum limit (commonly 0.2)
- SAR Value Calculation:
- The SAR moves closer to price as the trend progresses
- When price crosses the SAR, the indicator flips (Stop and Reverse)
How to Interpret Parabolic SAR Signals
Understanding the signals generated by the Parabolic SAR is key to using it effectively.
//1. Trend Direction
The position of the dots tells you the current trend:
- Below price → Uptrend
- Above price → Downtrend
This makes it easy for traders to quickly assess market direction.
//2. Entry Signals
A potential entry occurs when the dots switch position:
- Buy Signal: When dots move from above the price to below
- Sell Signal: When dots move from below the price to above
These flips suggest a possible trend reversal.
//3. Exit Signals
The Parabolic SAR is especially useful for determining exit points:
- In a long position, exit when dots appear above price
- In a short position, exit when dots appear below price
This “stop and reverse” mechanism helps traders lock in profits and limit losses.
Example of Parabolic SAR in Action
Imagine a stock in an uptrend:
- The SAR dots appear below the price
- As the price rises, the dots move upward, following the trend
- Eventually, the price starts to fall and crosses the SAR
- The dots flip above the price → signaling a potential downtrend
This is the moment when traders may close long positions or open short positions.
Advantages of the Parabolic SAR Indicator
//1. Simple and Visual
The indicator is easy to read, even for beginners. The dot-based system provides clear signals without requiring complex interpretation.
//2. Effective in Trending Markets
The Parabolic SAR performs best when the market is trending strongly, helping traders stay in trades longer.
//3. Built-in Stop-Loss Mechanism
Because the indicator continuously adjusts, it acts as a dynamic trailing stop-loss tool.
//4. Helps Reduce Emotional Trading
By providing clear entry and exit signals, it reduces guesswork and emotional decision-making.
Limitations of the Parabolic SAR
While useful, the Parabolic SAR is not perfect.
//1. Poor Performance in Sideways Markets
In ranging or choppy markets, the indicator generates many false signals, leading to potential losses.
//2. Lagging Indicator
Like most trend-following tools, the Parabolic SAR reacts to price movements rather than predicting them.
//3. Requires Confirmation
Using the Parabolic SAR alone may not be sufficient. It is best combined with other indicators.
Best Strategies for Using Parabolic SAR
To maximize its effectiveness, traders often combine the Parabolic SAR with other tools.
//1. Combine with Moving Averages (MA)
Use a moving average to confirm the trend:
- Only take buy signals when price is above the moving average
- Only take sell signals when price is below
//2. Use with RSI (Relative Strength Index)
The RSI can help confirm whether a market is overbought or oversold:
- Combine SAR buy signals with RSI oversold conditions
- Combine SAR sell signals with RSI overbought conditions
//3. Filter with Trend Strength Indicators
Indicators like the Average Directional Index (ADX) can help determine if a trend is strong enough to rely on SAR signals.
//4. Adjust the Acceleration Factor
Traders can customize the SAR settings:
- Higher AF: More sensitive, faster signals (more false signals)
- Lower AF: Smoother, fewer signals (but more lag)

When Should You Use Parabolic SAR?
The Parabolic SAR works best in the following situations:
- Strong trending markets.
- Swing trading strategies.
- Trailing stop-loss management.
It is less effective in:
- Sideways or low-volatility markets.
- Highly erratic price movements.
Practical Tips for Beginners
If you’re new to the Parabolic SAR, keep these tips in mind:
- Start with default settings before customizing.
- Avoid using it alone—combine with other indicators.
- Practice on demo accounts before trading real money.
- Pay attention to market conditions (trend vs range).
- Use risk management at all times.
Conclusion
The Parabolic SAR indicator is a powerful yet simple tool for identifying trends and managing trades. By providing clear visual signals for entry, exit, and trend direction, it helps traders make more informed decisions.
However, like any indicator, it should not be used in isolation. Its effectiveness increases significantly when combined with other technical analysis tools and proper risk management strategies.
Whether you are a beginner looking for an easy-to-understand indicator or an experienced trader seeking to refine your strategy, the Parabolic SAR can be a valuable addition to your trading toolkit.