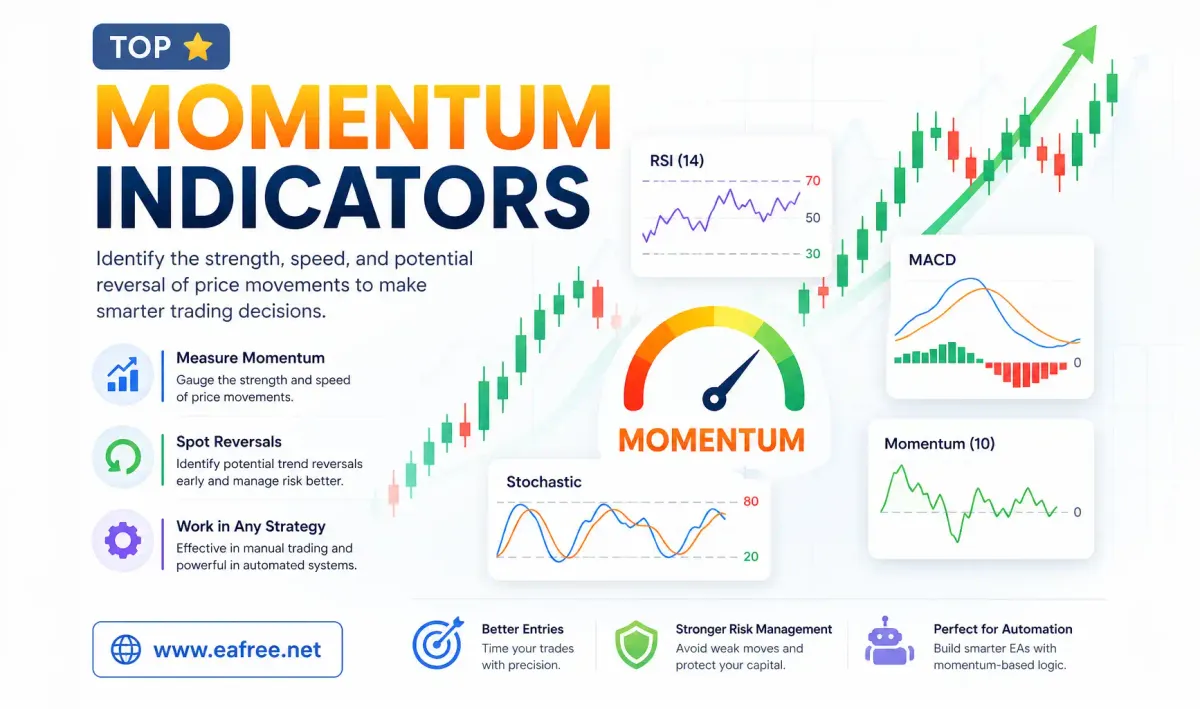
Momentum indicators are essential tools in forex trading that help traders identify the strength, speed and potential reversal of price movements. Whether you're a beginner or an experienced trader, understanding how momentum works can significantly improve your decision-making process—especially when integrating strategies into automated trading systems.
In this article, we’ll explore the most important momentum indicators, how they work, and how you can apply them effectively in both manual and automated trading.
What are Momentum Indicators?
Momentum indicators are technical analysis tools that measure the rate of change in price movements. Instead of focusing solely on price direction, they evaluate how strong or weak a trend is.
These indicators are typically oscillators, meaning they move within a fixed range (e.g., 0–100), helping traders identify overbought and oversold conditions.
Momentum indicators are particularly useful for:
- Identifying trend strength.
- Spotting potential reversals.
- Confirming entry and exit signals.
Relative Strength Index (RSI)
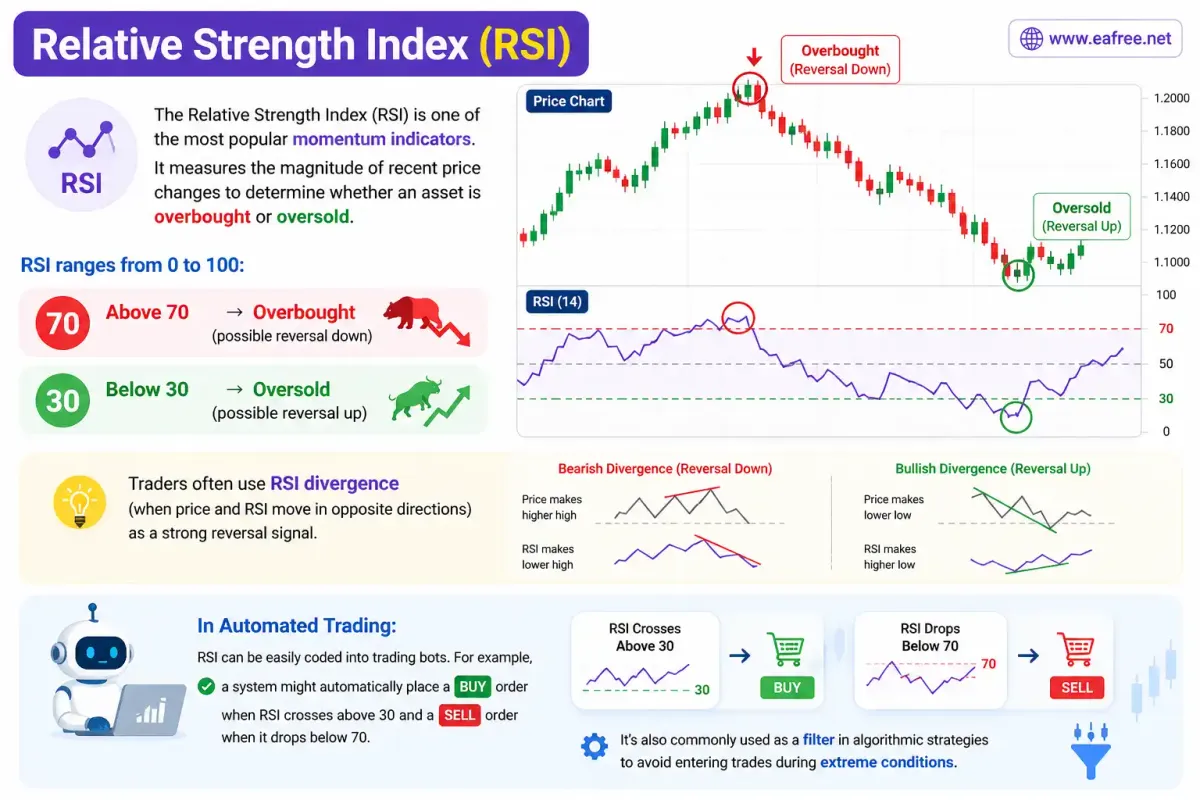
The Relative Strength Index (RSI) is one of the most popular momentum indicators. It measures the magnitude of recent price changes to determine whether an asset is overbought or oversold.
RSI ranges from 0 to 100:
- Above 70 → Overbought (possible reversal down)
- Below 30 → Oversold (possible reversal up)
Traders often use RSI divergence (when price and RSI move in opposite directions) as a strong reversal signal.
In automated trading:
RSI can be easily coded into trading bots. For example, a system might automatically place a buy order when RSI crosses above 30 and a sell order when it drops below 70. It’s also commonly used as a filter in algorithmic strategies to avoid entering trades during extreme conditions.
Moving Average Convergence Divergence (MACD)
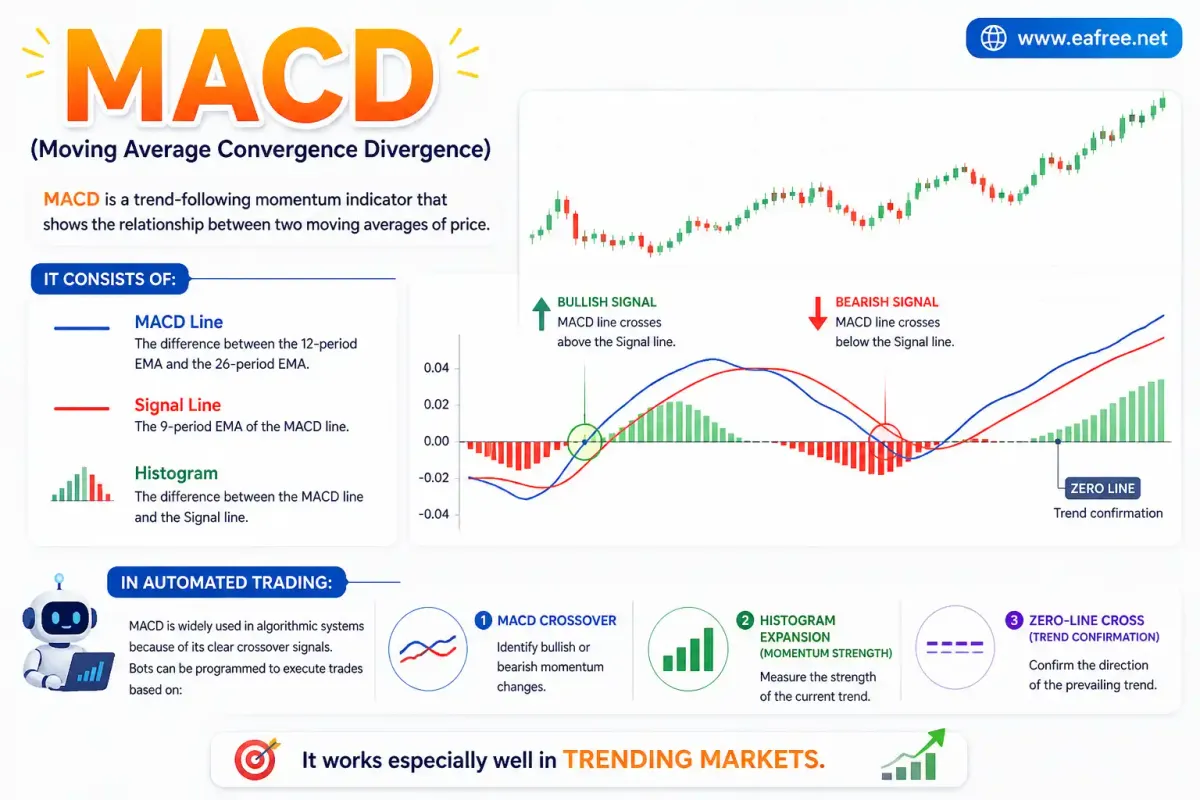
MACD is a trend-following momentum indicator that shows the relationship between two moving averages of price.
It consists of:
- MACD Line
- Signal Line
- Histogram
When the MACD line crosses above the signal line, it generates a bullish signal. When it crosses below, it signals bearish momentum.
In automated trading:
MACD is widely used in algorithmic systems because of its clear crossover signals. Bots can be programmed to execute trades based on:
- MACD crossover
- Histogram expansion (momentum strength)
- Zero-line cross (trend confirmation)
It works especially well in trending markets.
Stochastic Oscillator
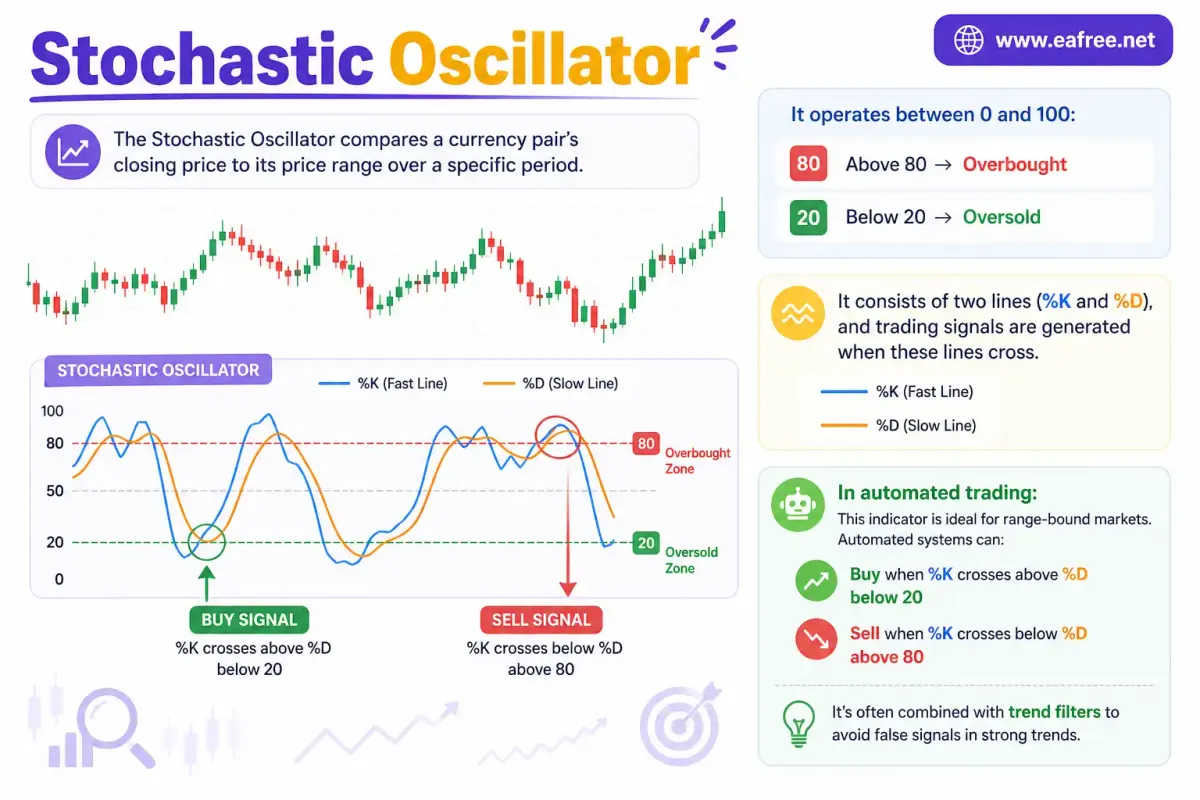
The Stochastic Oscillator compares a currency pair’s closing price to its price range over a specific period.
It operates between 0 and 100:
- Above 80 → Overbought
- Below 20 → Oversold
It consists of two lines (%K and %D), and trading signals are generated when these lines cross.
In automated trading:
This indicator is ideal for range-bound markets. Automated systems can:
- Buy when %K crosses above %D below 20
- Sell when %K crosses below %D above 80
It’s often combined with trend filters to avoid false signals in strong trends.
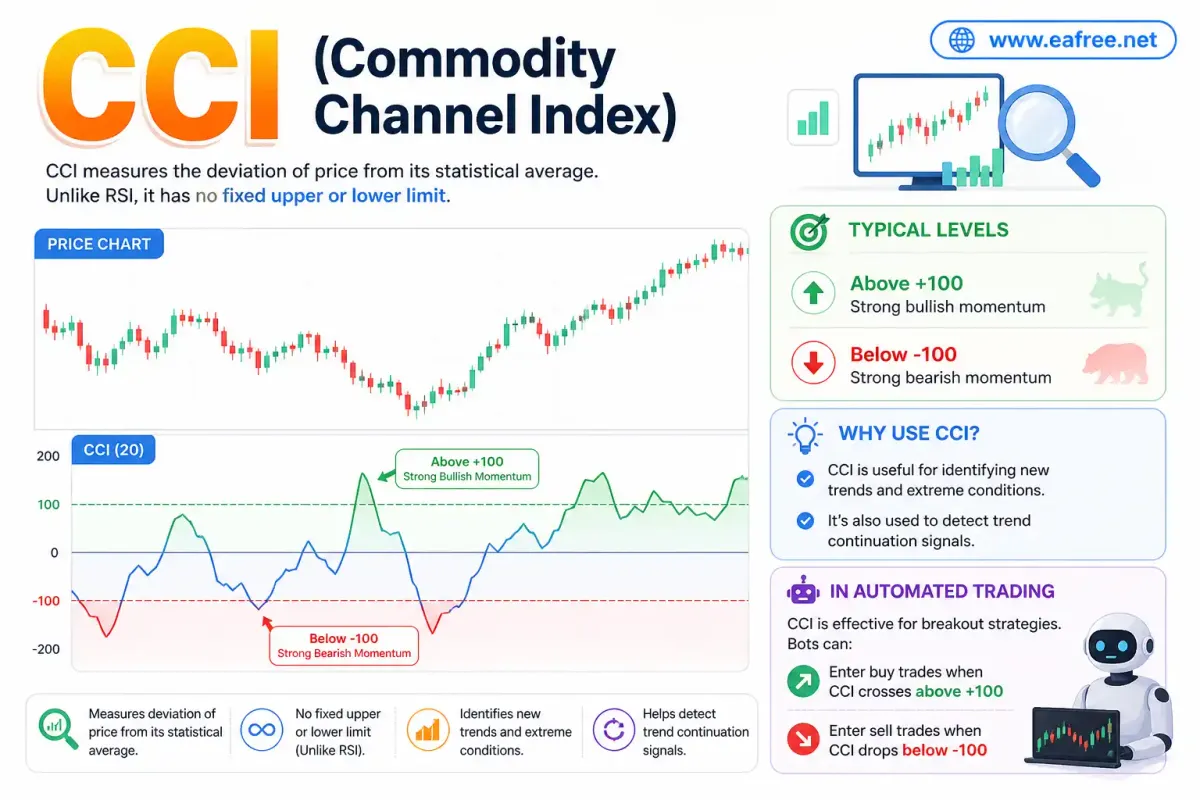
Commodity Channel Index (CCI)
CCI measures the deviation of price from its statistical average. Unlike RSI, it has no fixed upper or lower limit.
Typical levels:
- Above +100 → Strong bullish momentum
- Below -100 → Strong bearish momentum
CCI is useful for identifying new trends and extreme conditions.
In automated trading:
CCI is effective for breakout strategies. Bots can:
- Enter buy trades when CCI crosses above +100
- Enter sell trades when it drops below -100
It’s also used to detect trend continuation signals.
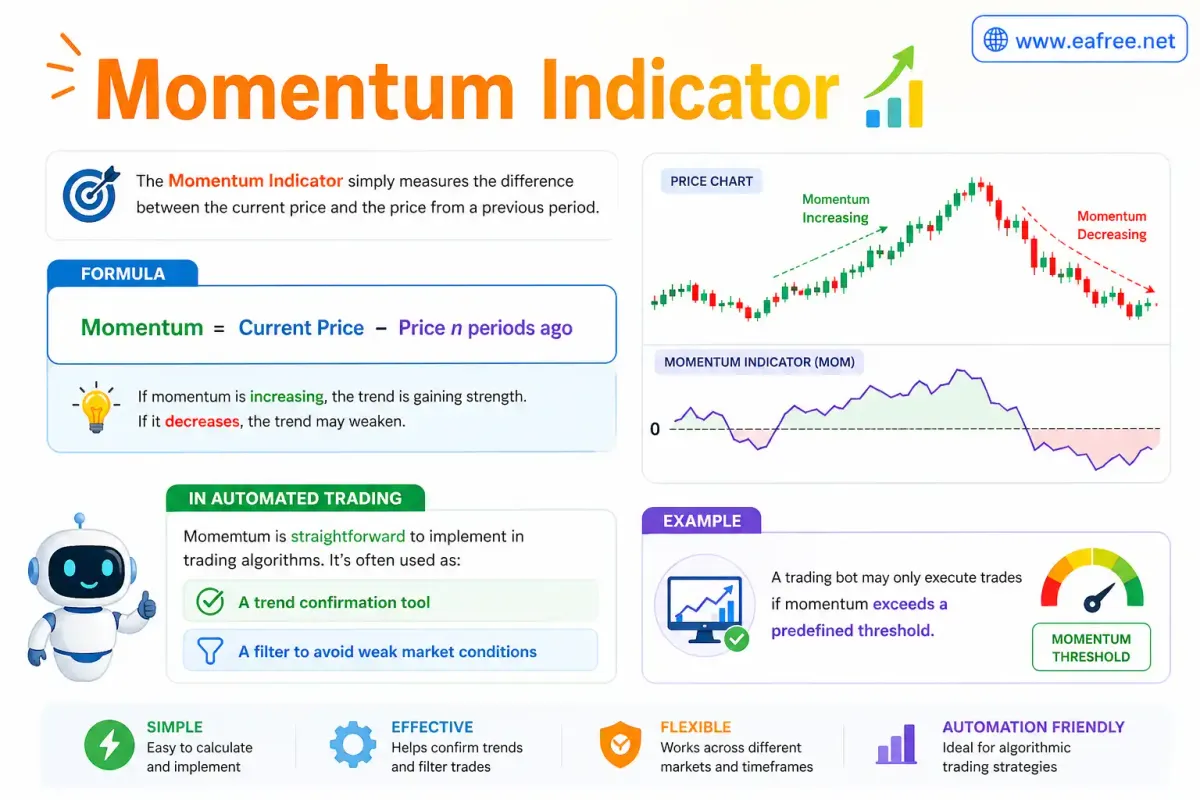
Momentum Indicator (MOM)
The Momentum Indicator simply measures the difference between the current price and the price from a previous period.
Formula:
Momentum = Current Price – Price n periods ago
If momentum is increasing, the trend is gaining strength. If it decreases, the trend may weaken.
In automated trading:
Momentum is straightforward to implement in trading algorithms. It’s often used as:
- A trend confirmation tool
- A filter to avoid weak market conditions
For example, a bot may only execute trades if momentum exceeds a predefined threshold.
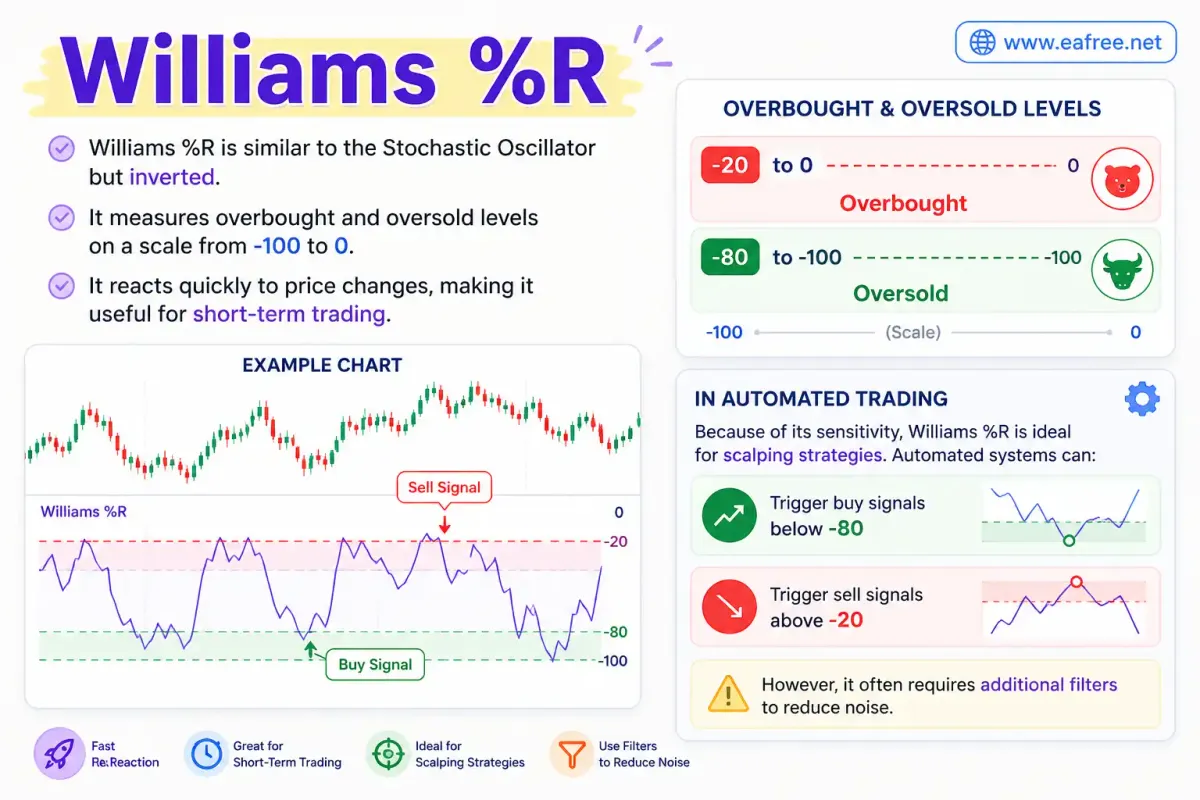
Williams %R
Williams %R is similar to the Stochastic Oscillator but inverted. It measures overbought and oversold levels on a scale from -100 to 0.
- Between -20 and 0 → Overbought
- Between -80 and -100 → Oversold
It reacts quickly to price changes, making it useful for short-term trading.
In automated trading:
Because of its sensitivity, Williams %R is ideal for scalping strategies. Automated systems can:
- Trigger buy signals below -80
- Trigger sell signals above -20
However, it often requires additional filters to reduce noise.
Comparison Table of Momentum Indicators
| Indicator | Range | Best Use Case | Strength | Weakness |
|---|---|---|---|---|
| RSI | 0–100 | Reversal signals | Simple and reliable | Can give false signals in trends |
| MACD | No limit | Trend + momentum | Strong for trend confirmation | Lagging indicator |
| Stochastic Oscillator | 0–100 | Range trading | Fast and responsive | Noisy in trending markets |
| CCI | No limit | Breakouts | Detects new trends early | Harder to interpret |
| Momentum (MOM) | No limit | Trend strength | Simple calculation | Lacks overbought/oversold levels |
| Williams %R | -100 to 0 | Short-term signals | Very sensitive | High false signal rate |
How to Combine Momentum Indicators
Using a single indicator can be risky. Many professional traders combine multiple momentum indicators to improve accuracy.
For example:
- RSI + MACD → Confirm reversals and trend direction
- Stochastic + CCI → Identify entries in ranging markets
- Momentum + Moving Average → Confirm trend strength
Combining indicators reduces false signals and increases confidence in trade setups.
Applying Momentum Indicators in Automated Trading
Momentum indicators are highly suitable for algorithmic trading because they are rule-based and quantifiable.
Here’s how they can be integrated into automated systems:
//1. Signal Generation
Indicators like RSI, MACD, and Stochastic provide clear entry and exit conditions. These can be directly coded into trading bots.
//2. Trade Filtering
Momentum indicators can act as filters to avoid bad trades. For example:
- Only trade when RSI is between 30–70
- Avoid trading when momentum is weak
//3. Risk Management
Momentum can help adjust position sizes dynamically:
- Strong momentum → Larger position
- Weak momentum → Smaller position
//4. Multi-Indicator Strategies
Automated systems can combine multiple indicators to create robust strategies. For example:
- Entry: MACD crossover
- Confirmation: RSI above 50
- Exit: Stochastic overbought
//5. Backtesting Optimization
Momentum indicators are ideal for backtesting because they rely on historical price data. Traders can optimize parameters such as:
- RSI period
- MACD settings
- Threshold levels
Common Mistakes to Avoid
Even though momentum indicators are powerful, traders often misuse them:
- Over-reliance on one indicator: Always confirm signals with other tools
- Ignoring market conditions: Some indicators work better in trends, others in ranges
- Over-optimization in bots: Avoid curve-fitting strategies to past data
- Not adjusting parameters: Different currency pairs may require different settings
Conclusion
Momentum indicators are indispensable tools for forex traders. They provide insights into trend strength, potential reversals, and optimal entry/exit points. From RSI and MACD to Stochastic and CCI, each indicator offers unique advantages depending on market conditions.
When combined effectively—and especially when integrated into automated trading systems—momentum indicators can significantly enhance trading performance. The key is to understand their strengths, avoid common pitfalls, and continuously refine your strategy through testing and optimization.