What Are Trendlines in Forex?
//🎯 Definition of Trendlines
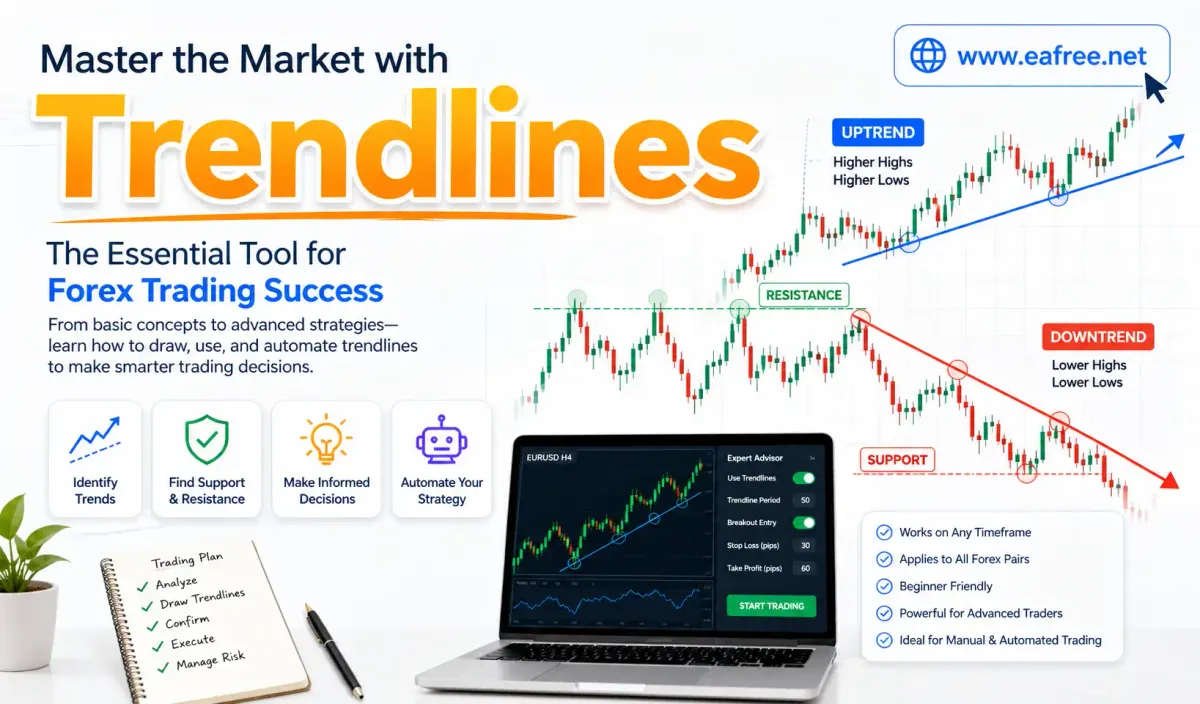
Trendlines are one of the most fundamental tools in Forex trading. They are diagonal lines drawn on a price chart to connect a series of price points—typically highs or lows—to help traders visualize the direction of the market.
- An uptrend line connects higher lows
- A downtrend line connects lower highs
These lines act as dynamic levels of support and resistance, guiding traders in understanding price movement over time.
//🎯 Why Trendlines Are Essential in Trading
Trendlines are powerful because they simplify complex price data into clear, actionable insights. Traders rely on them to:
- Identify the overall market direction
- Anticipate potential reversal points
- Find entry and exit opportunities
- Improve timing for trades
In essence, trendlines help traders “read” the market structure more effectively.
//🎯 Types: Uptrend, Downtrend, Sideways
There are three main market conditions reflected through trendlines:
- Uptrend: Price moves upward with higher highs and higher lows
- Downtrend: Price moves downward with lower highs and lower lows
- Sideways (Range-bound): Price moves horizontally with no clear trend
Recognizing these types is crucial before applying any trading strategy.

How to Draw Trendlines Correctly
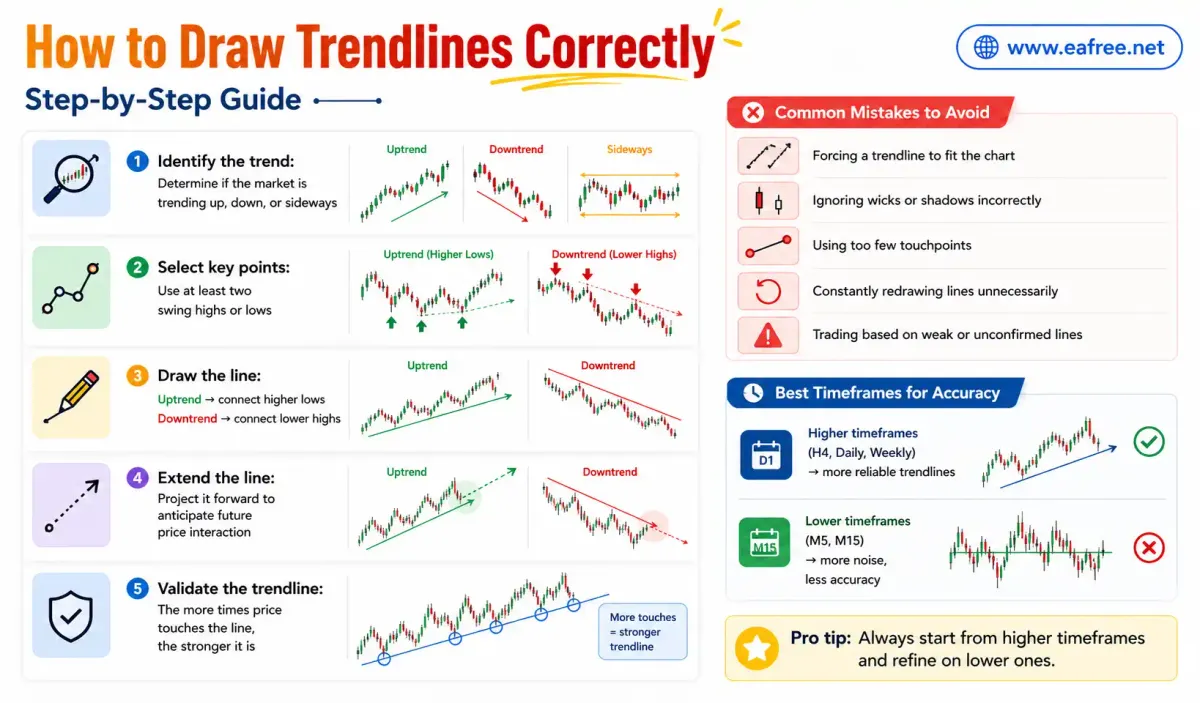
//🎯 Step-by-Step Guide
- Identify the trend: Determine if the market is trending up, down, or sideways
- Select key points: Use at least two swing highs or lows
- Draw the line:
- Uptrend → connect higher lows
- Downtrend → connect lower highs
- Extend the line: Project it forward to anticipate future price interaction
- Validate the trendline: The more times price touches the line, the stronger it is
//🎯 Common Mistakes to Avoid
- Forcing a trendline to fit the chart
- Ignoring wicks or shadows incorrectly
- Using too few touchpoints
- Constantly redrawing lines unnecessarily
- Trading based on weak or unconfirmed lines
//🎯 Best Timeframes for Accuracy
- Higher timeframes (H4, Daily, Weekly) → more reliable trendlines
- Lower timeframes (M5, M15) → more noise, less accuracy
Pro tip: Always start from higher timeframes and refine on lower ones.
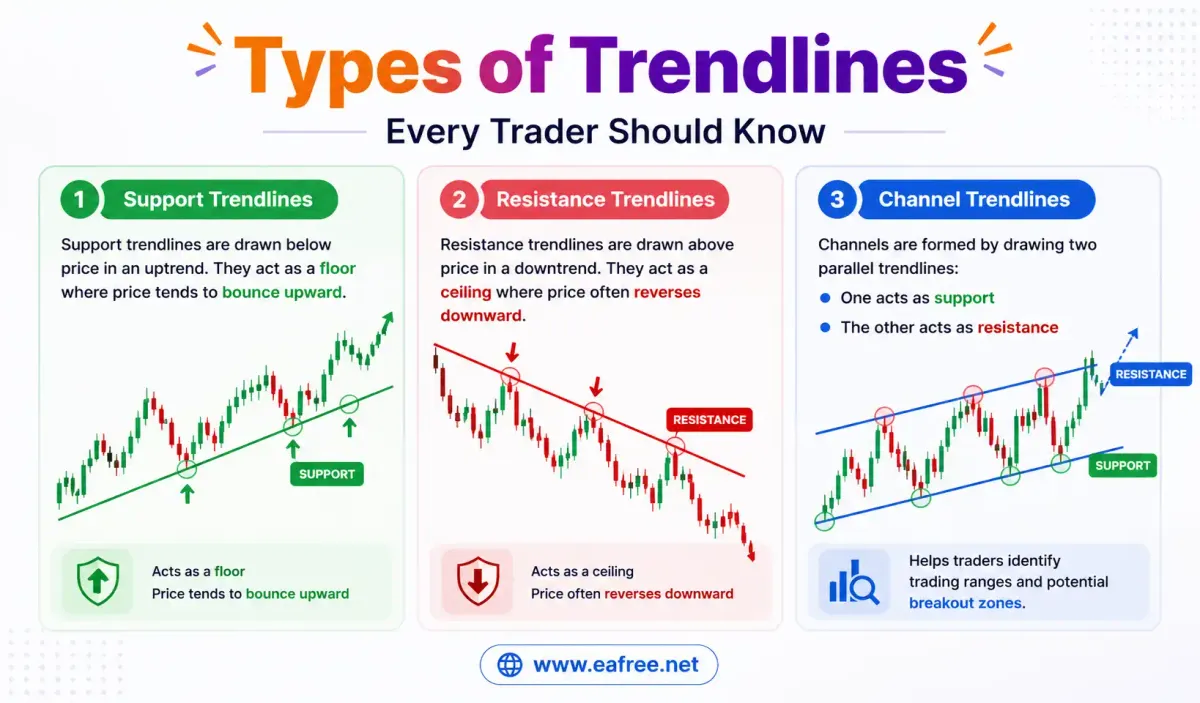
Types of Trendlines Every Trader Should Know
//🎯 Support Trendlines
Support trendlines are drawn below price in an uptrend. They act as a floor where price tends to bounce upward.
//🎯 Resistance Trendlines
Resistance trendlines are drawn above price in a downtrend. They act as a ceiling where price often reverses downward.
//🎯 Channel Trendlines
Channels are formed by drawing two parallel trendlines:
- One acts as support
- The other acts as resistance
Channels help traders identify trading ranges and potential breakout zones.
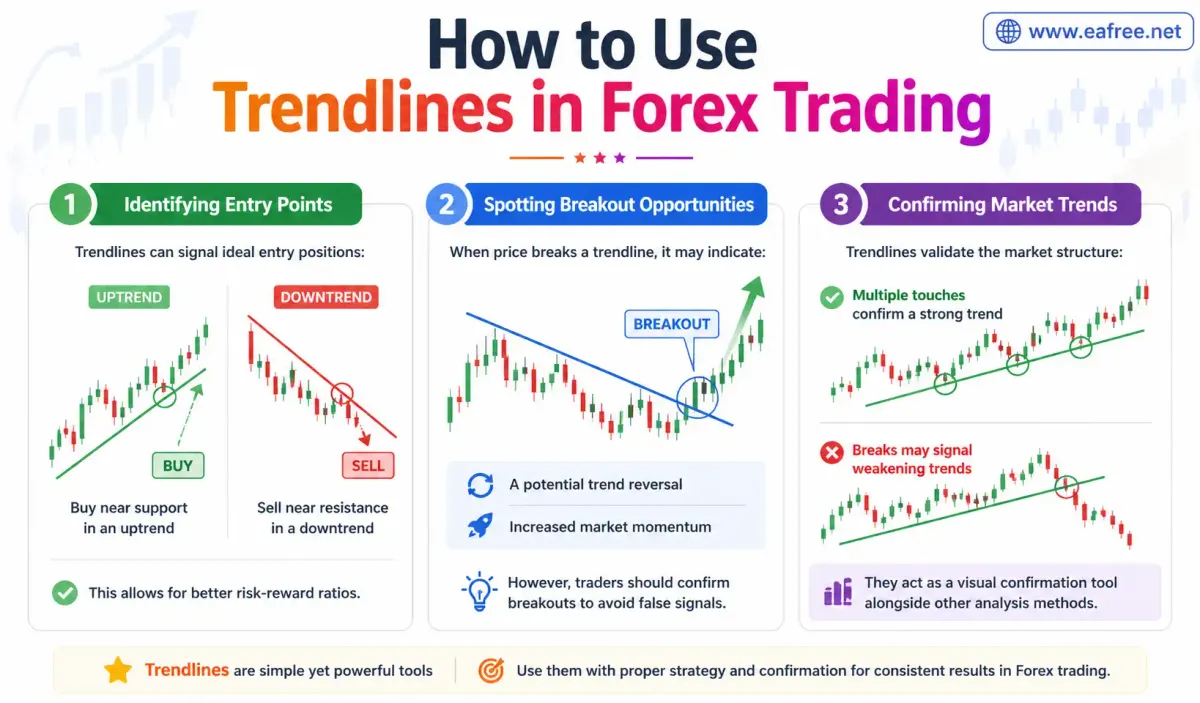
How to Use Trendlines in Forex Trading
//🎯 Identifying Entry Points
Trendlines can signal ideal entry positions:
- Buy near support in an uptrend
- Sell near resistance in a downtrend
This allows for better risk-reward ratios.
//🎯 Spotting Breakout Opportunities
When price breaks a trendline, it may indicate:
- A potential trend reversal
- Increased market momentum
However, traders should confirm breakouts to avoid false signals.
//🎯 Confirming Market Trends
Trendlines validate the market structure:
- Multiple touches confirm a strong trend
- Breaks may signal weakening trends
They act as a visual confirmation tool alongside other analysis methods.
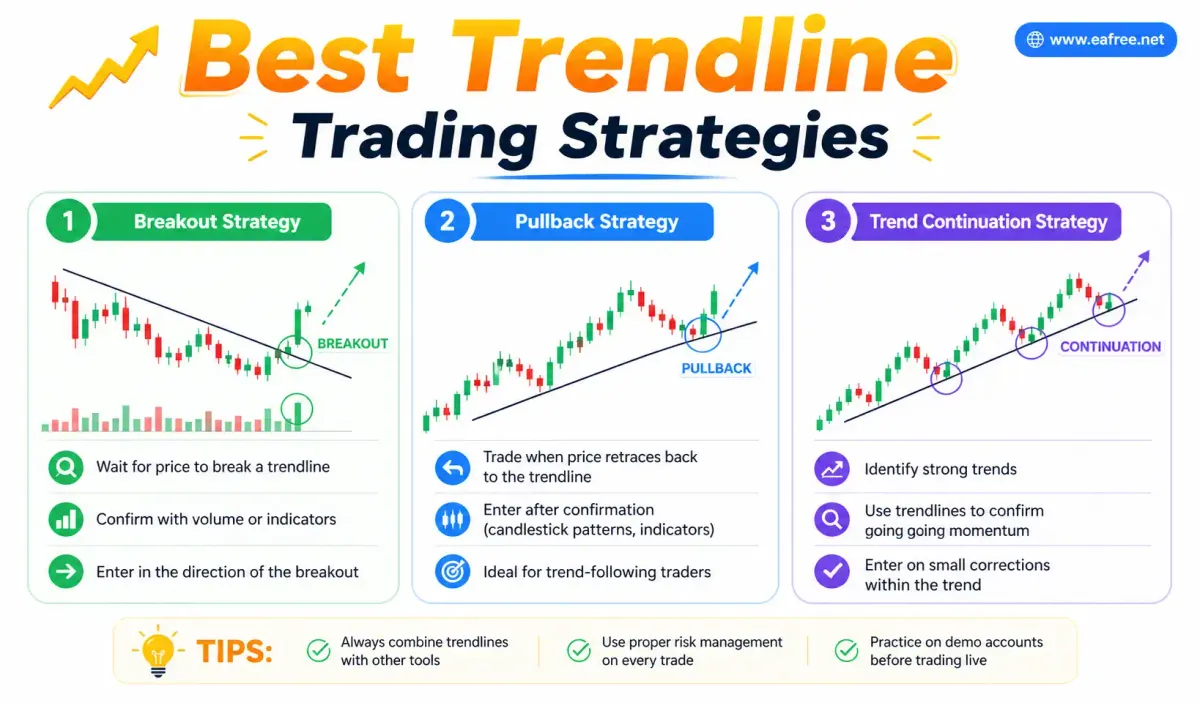
Best Trendline Trading Strategies
//🎯 Breakout Strategy
- Wait for price to break a trendline
- Confirm with volume or indicators
- Enter in the direction of the breakout
//🎯 Pullback Strategy
- Trade when price retraces back to the trendline
- Enter after confirmation (candlestick patterns, indicators)
- Ideal for trend-following traders
//🎯 Trend Continuation Strategy
- Identify strong trends
- Use trendlines to confirm ongoing momentum
- Enter on small corrections within the trend
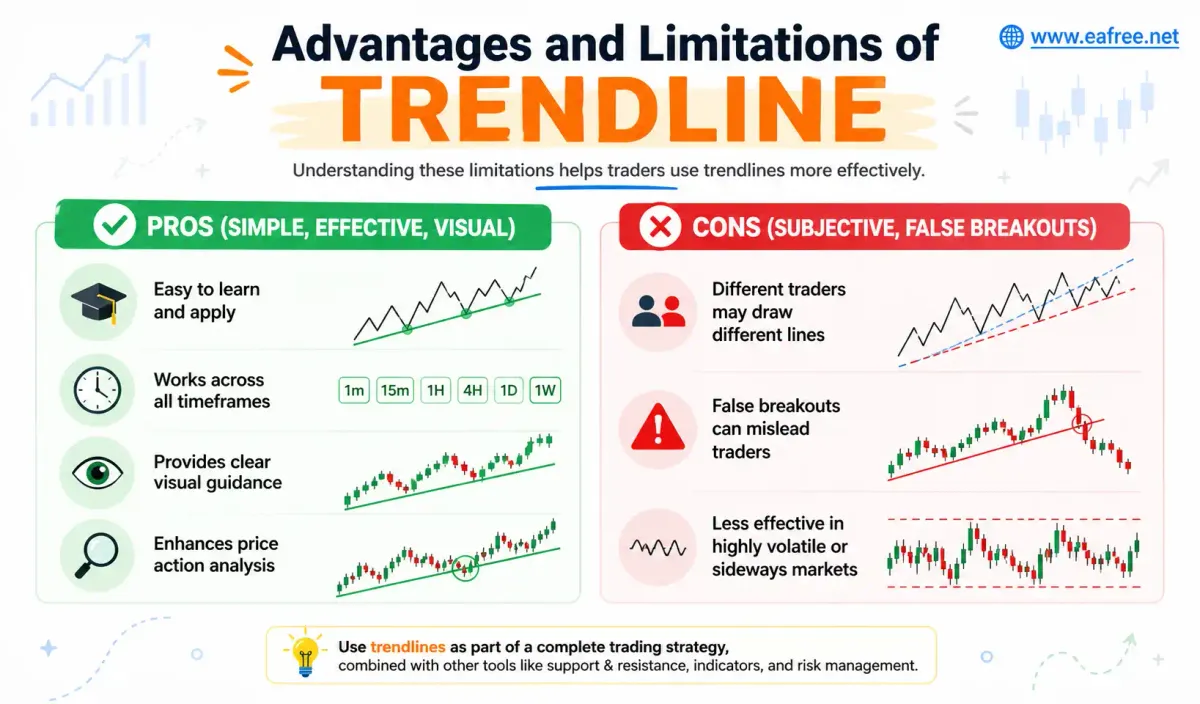
Advantages and Limitations of Trendlines
//🎯 Pros (Simple, Effective, Visual)
- Easy to learn and apply
- Works across all timeframes
- Provides clear visual guidance
- Enhances price action analysis
//🎯 Cons (Subjective, False Breakouts)
- Different traders may draw different lines
- False breakouts can mislead traders
- Less effective in highly volatile or sideways markets
Understanding these limitations helps traders use trendlines more effectively.
Pro Tips for Using Trendlines Like a Pro
//Combine with Indicators (RSI, MACD)
Trendlines become more powerful when combined with technical indicators:
This combination reduces false signals.
//Use Multiple Timeframes
Analyze trendlines across different timeframes:
- Higher timeframe → overall trend
- Lower timeframe → precise entries
This approach improves accuracy and confidence.
//Risk Management Tips
- Always use stop-loss orders
- Avoid over-leveraging
- Risk only a small percentage per trade (1–2%)
- Don’t rely solely on trendlines
Risk management is what keeps traders in the game long-term.
Conclusion
Trendlines are one of the most essential tools in Forex trading, offering a simple yet powerful way to understand market direction, identify key levels, and plan trades effectively. From drawing them correctly to applying advanced strategies like breakouts and pullbacks, mastering trendlines can significantly improve trading performance.
However, like any tool, they are not perfect. Combining them with indicators, multiple timeframe analysis, and solid risk management is key to success.
The best way to truly master trendlines is through practice and testing. Spend time analyzing charts, refining your skills, and building your own trading system—because consistency comes from experience, not theory.