What is the Williams %R Indicator?
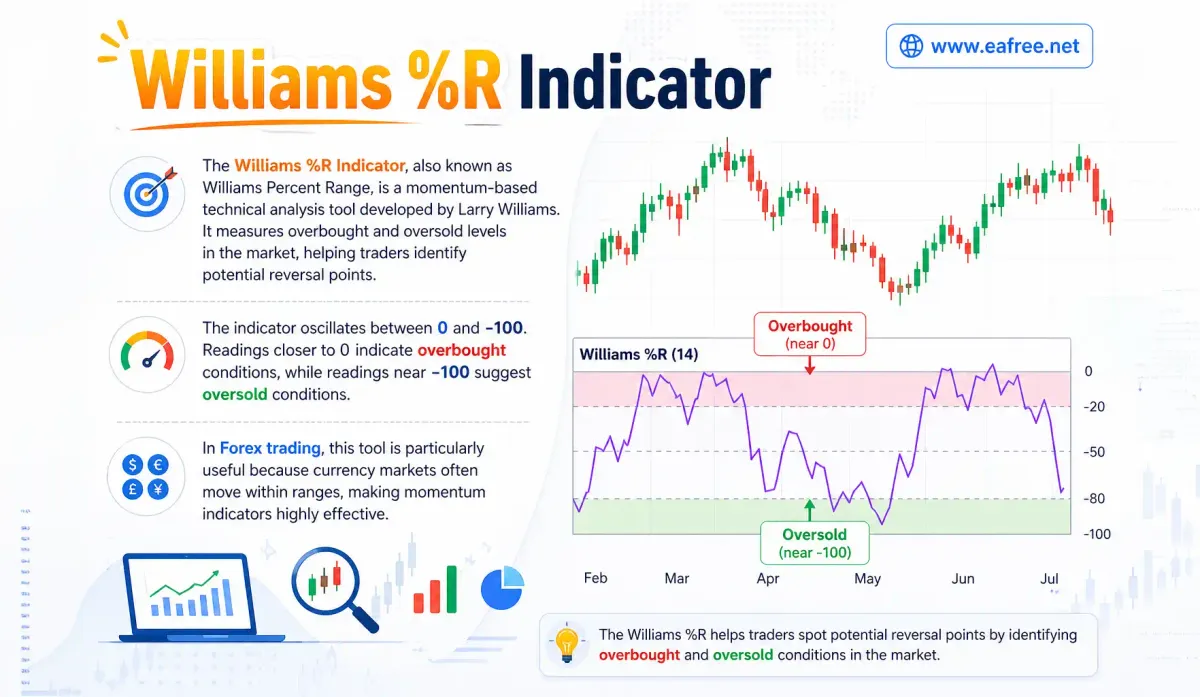
The Williams %R Indicator, also known as Williams Percent Range, is a momentum-based technical analysis tool developed by Larry Williams. It measures overbought and oversold levels in the market, helping traders identify potential reversal points.
The indicator oscillates between 0 and -100. Readings closer to 0 indicate overbought conditions, while readings near -100 suggest oversold conditions. In Forex trading, this tool is particularly useful because currency markets often move within ranges, making momentum indicators highly effective.
How Does Williams %R Work?
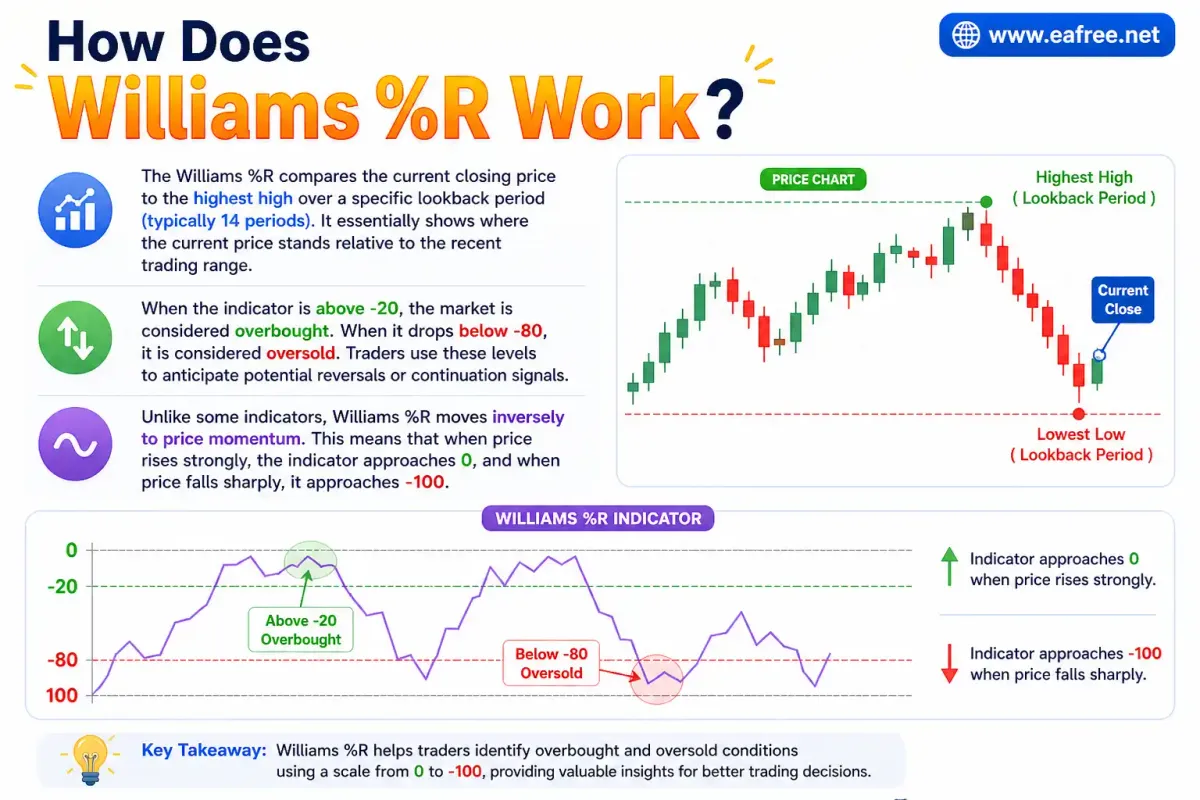
The Williams %R compares the current closing price to the highest high over a specific lookback period (typically 14 periods). It essentially shows where the current price stands relative to the recent trading range.
When the indicator is above -20, the market is considered overbought. When it drops below -80, it is considered oversold. Traders use these levels to anticipate potential reversals or continuation signals.
Unlike some indicators, Williams %R moves inversely to price momentum. This means that when price rises strongly, the indicator approaches 0, and when price falls sharply, it approaches -100.
Formula of Williams %R
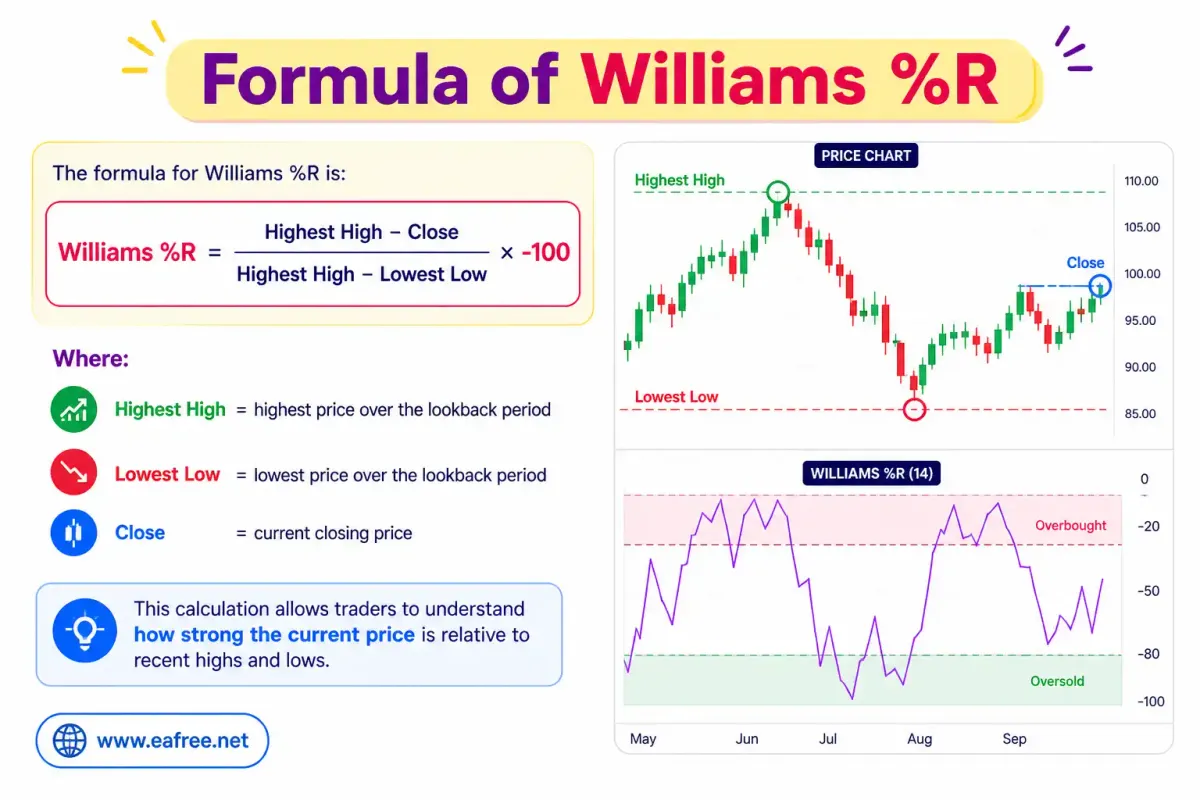
The formula for Williams %R is:
Williams %R = (Highest High - Close) / (Highest High - Lowest Low) × -100
Where:
- Highest High = highest price over the lookback period.
- Lowest Low = lowest price over the lookback period.
- Close = current closing price.
This calculation allows traders to understand how strong the current price is relative to recent highs and lows.
Key Levels and Interpretation
Understanding how to interpret Williams %R is crucial for effective trading. The main levels are:
| Level | Meaning | Trading Insight |
|---|---|---|
| 0 to -20 | Overbought | Possible downward reversal |
| -20 to -80 | Neutral | No strong signal |
| -80 to -100 | Oversold | Possible upward reversal |
However, it is important to note that overbought does not always mean price will fall immediately, and oversold does not guarantee a rise. Strong trends can keep the indicator in extreme zones for extended periods.
Basic Trading Strategies Using Williams %R
//🎯 Overbought and Oversold Strategy
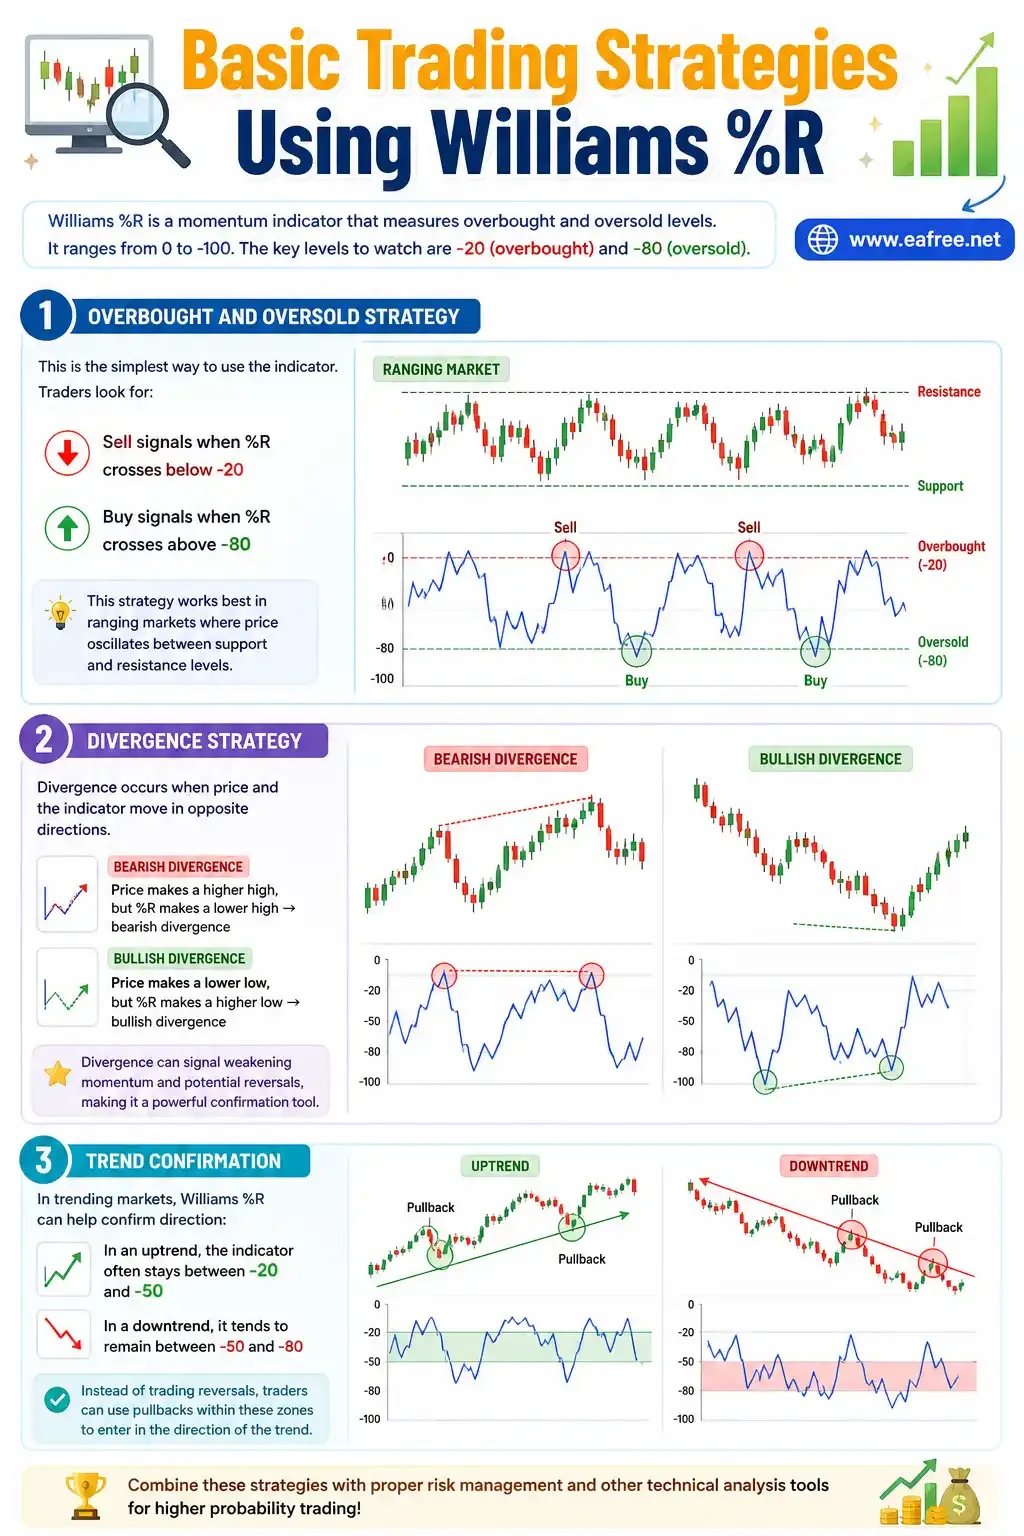
This is the simplest way to use the indicator. Traders look for:
- Sell signals when %R crosses below -20
- Buy signals when %R crosses above -80
This strategy works best in ranging markets where price oscillates between support and resistance levels.
//🎯 Divergence Strategy
Divergence occurs when price and the indicator move in opposite directions. For example:
- Price makes a higher high, but %R makes a lower high → bearish divergence
- Price makes a lower low, but %R makes a higher low → bullish divergence
Divergence can signal weakening momentum and potential reversals, making it a powerful confirmation tool.
//🎯 Trend Confirmation
In trending markets, Williams %R can help confirm direction:
- In an uptrend, the indicator often stays between -20 and -50
- In a downtrend, it tends to remain between -50 and -80
Instead of trading reversals, traders can use pullbacks within these zones to enter in the direction of the trend.
Advantages and Limitations
//🎯 Advantages
- Simple and easy to understand
- Effective in identifying overbought/oversold conditions
- Works well in ranging markets
- Can be combined with other indicators
//🎯 Limitations
- Generates false signals in strong trends
- Not suitable as a standalone indicator
- Requires confirmation from price action or other tools
Understanding both strengths and weaknesses helps traders avoid common mistakes and improve decision-making.
Best Indicator Combinations
To increase accuracy, Williams %R is often combined with other indicators:
- Moving Averages: Identify overall trend direction.
- RSI (Relative Strength Index): Confirm overbought/oversold conditions.
- Support & Resistance: Validate entry and exit points.
- MACD: Confirm momentum and trend strength.
Combining indicators reduces false signals and improves trading confidence.
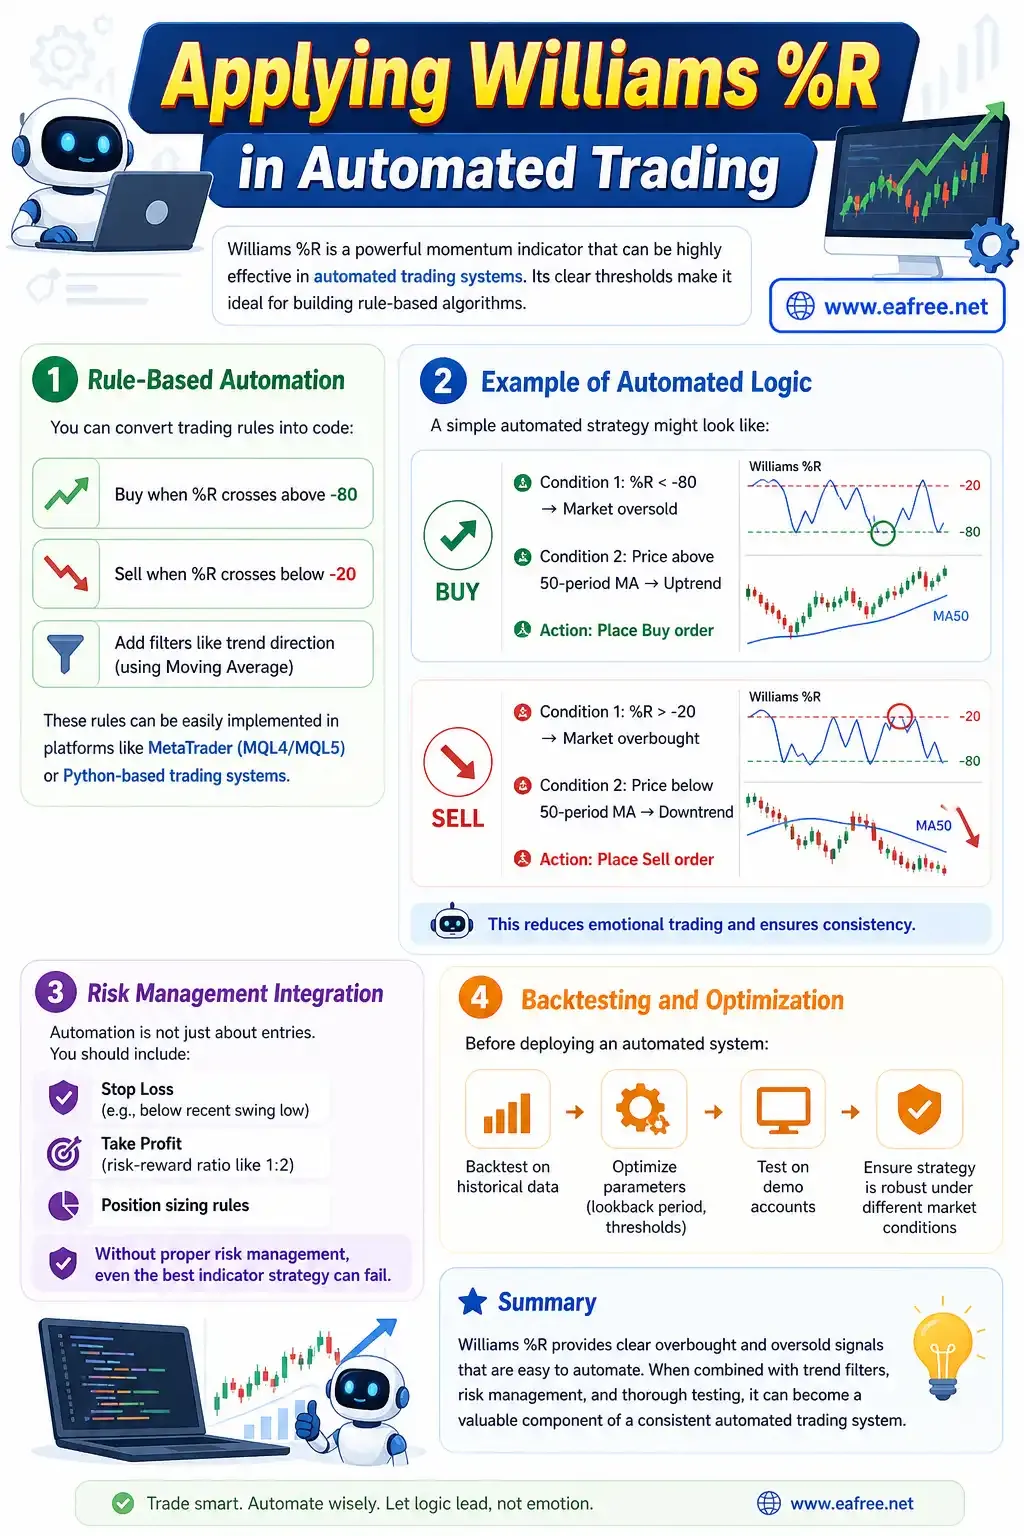
Applying Williams %R in Automated Trading
One of the most practical uses of Williams %R is in automated trading systems (Forex bots or Expert Advisors). Its clear numerical thresholds make it ideal for algorithmic strategies.
//🎯 Rule-Based Automation
You can convert trading rules into code:
- Buy when %R crosses above -80
- Sell when %R crosses below -20
- Add filters like trend direction (using Moving Average)
These rules can be easily implemented in platforms like MetaTrader (MQL4/MQL5) or Python-based trading systems.
//🎯 Example of Automated Logic
A simple automated strategy might look like:
- Condition 1: %R < -80 → Market oversold
- Condition 2: Price above 50-period MA → Uptrend
- Action: Place Buy order
- Condition 1: %R > -20 → Market overbought
- Condition 2: Price below 50-period MA → Downtrend
- Action: Place Sell order
This reduces emotional trading and ensures consistency.
//🎯 Risk Management Integration
Automation is not just about entries. You should include:
- Stop Loss (e.g., below recent swing low)
- Take Profit (risk-reward ratio like 1:2)
- Position sizing rules
Without proper risk management, even the best indicator strategy can fail.
//🎯 Backtesting and Optimization
Before deploying an automated system:
- Backtest on historical data
- Optimize parameters (lookback period, thresholds)
- Test on demo accounts
This ensures the strategy is robust under different market conditions.
Tips for Better Results
To use Williams %R effectively, consider the following tips:
- Avoid trading solely based on overbought/oversold signals
- Always confirm with trend or price action
- Adjust the period setting depending on your timeframe
- Use higher timeframes for more reliable signals
- Combine with risk management strategies
Consistency and discipline are more important than the indicator itself.
Conclusion
The Williams %R Indicator is a powerful yet simple tool for Forex traders. It helps identify overbought and oversold conditions, detect divergences and improve timing for entries and exits.
While it is not perfect on its own, combining it with other indicators and integrating it into automated trading systems can significantly enhance performance. Whether you are a manual trader or building a trading bot, Williams %R offers a flexible and practical approach to understanding market momentum.
By applying structured rules, testing strategies, and managing risk carefully, traders can turn this classic indicator into a reliable component of their trading toolkit.